
Observability on Azure AKS: Metrics, Logs and Traces
Learn how to bring metrics, logs and traces together in an existing AKS setup to investigate slow requests and application errors.
Applications can appear healthy while some requests are slow, background tasks fail or dependencies become unreliable. To understand what users are experiencing, we need to see what is happening inside the application and the services it depends on. We use metrics, logs and traces with Azure Monitor and Grafana to investigate failed requests on AKS.
Metrics, logs and traces give us different views of that behaviour. In this guide, we add them to an existing AKS and Terraform setup, then use a small demo application to follow a failed request and understand what happened.
Why do we need observability for applications on AKS?
When an API starts returning errors, we need to know how widespread the problem is, which requests were involved and where those requests failed.
Observability means using evidence from the system to understand its behaviour. That evidence, or telemetry, comes in several forms:
- Metrics are measurements over time: request counts, error rates and response durations. They reveal patterns, but normally do not identify one individual request.
- Logs record individual events. Structured fields let us find a request without searching unstructured messages by eye.
- Traces describe the operations performed for a request. Each operation is a span, with a start, an end and context. A trace can connect work across services when they propagate that context.
We will use Podinfo, an upstream demo service, rather than create another application project. Its metrics describe requests; its debug request-start logs include a trace ID; its OpenTelemetry instrumentation produces spans with that same ID. The investigation is manual: a graph narrows the time window, a log identifies a request and a trace confirms the outcome.
This follows the same exercise as Observability on Amazon EKS: Metrics, Logs and Traces. Here, Azure’s native services provide the collection and storage paths.
What does each component do?
Azure's native agents collect Prometheus metrics and container logs. A separate OpenTelemetry Collector forwards only traces. Azure Monitor workspaces and Log Analytics workspaces store different signals; Grafana and Azure's investigation tools query those stores.
| Component | Role in this guide |
|---|---|
| Existing AKS cluster | Runs Podinfo and the collectors; its provisioning and pipeline already exist. |
| Azure Monitor managed service for Prometheus | Stores scraped metrics in an Azure Monitor workspace. We query them with PromQL. |
Azure Monitor metrics add-on (ama-metrics) |
Owns the Podinfo scrape. It reads /metrics and sends samples to the managed service. |
Container insights / Azure Monitor Agent (ama-logs) |
Collects container stdout/stderr. It sends Podinfo's JSON events to ContainerLogV2 in a Log Analytics workspace. |
| Data Collection Rule (DCR) | Describes collection, destinations and, where configured, ingestion transformations. A DCR association connects an agent's rule to the AKS resource. |
| OpenTelemetry Collector | Receives Podinfo OTLP/gRPC spans and forwards HTTP/protobuf to Azure Monitor. It neither scrapes this application nor tails its logs. |
| Application Insights and Log Analytics | Provide trace investigation and KQL queries over the native OTLP span store. |
| Grafana Community Edition (OSS) on AKS | Self-hosted metrics interface, using a dedicated federated workload identity to query the Azure Monitor workspace. |
| Terraform, Helm and kubectl | Reuse the existing deployment process. One observability/ Terraform configuration creates the monitoring backends, rules, identities, roles and Collector/Grafana Helm releases. Only settings on the existing AKS resource remain in its current configuration. kubectl deploys Podinfo separately. |
Prometheus samples are stored in an Azure Monitor workspace; container logs and native OTLP spans are stored in Log Analytics. This example creates one Log Analytics workspace for both logs and traces, so the two KQL queries use the same destination. Separate workspaces are an optional adaptation, not a prerequisite. [1] · [2]
Architecture: how do the signals travel?
Podinfo's metrics travel through Azure's native metrics add-on to an Azure Monitor workspace. Container insights sends its logs to Log Analytics; an OpenTelemetry Collector forwards its traces through Azure Monitor's native OTLP ingestion. Grafana queries the metrics.
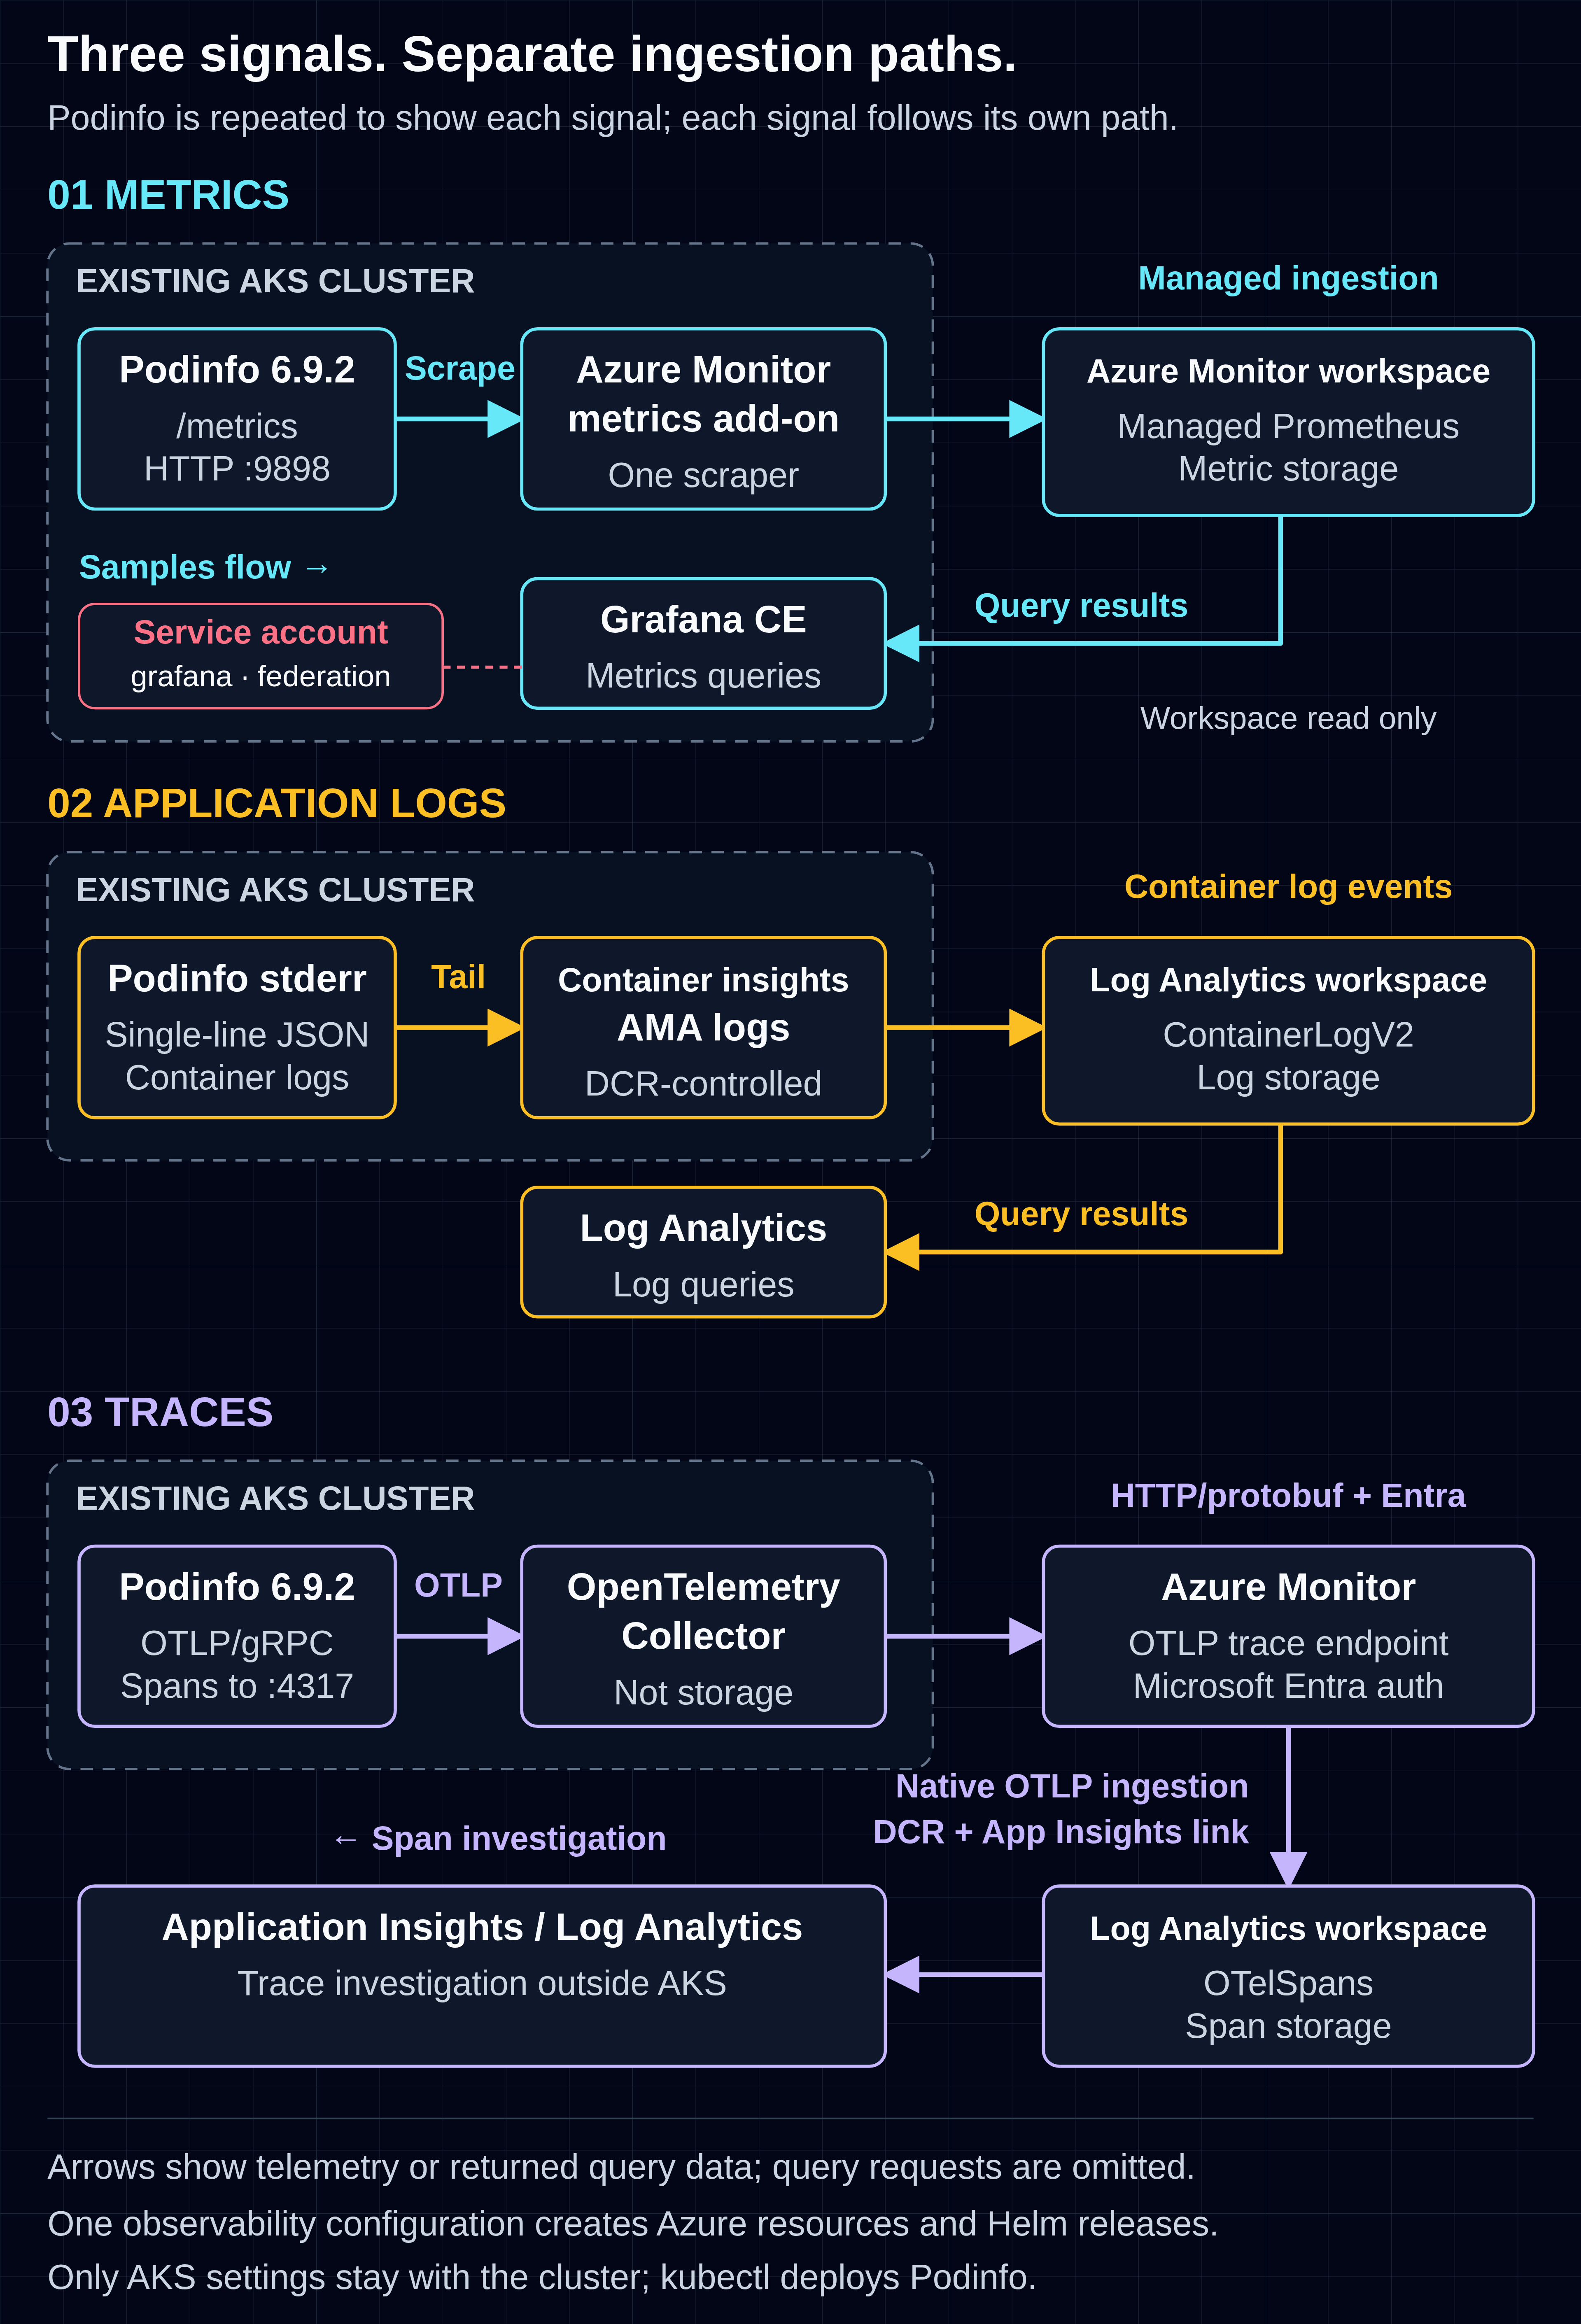
The three lanes show the same Podinfo deployment. Grafana CE runs inside AKS; the Azure query interfaces remain outside it. The Collector belongs only in the trace lane: adding another Prometheus receiver would duplicate the native agent's scrape.
How do traces reach Azure Monitor?
Podinfo 6.9.2 exports OTLP/gRPC. Azure Monitor's direct Collector ingestion uses HTTP/protobuf and Microsoft Entra authentication. The Collector converts gRPC to HTTP/protobuf and authenticates to Azure using a workload identity.
Microsoft describes direct Collector ingestion as generally available; the separate AMA and AKS application-monitoring add-ons remain preview. We use the direct route with Podinfo’s existing instrumentation. [28]
The example files are available in the companion repository:
https://github.com/ferhaty/aks-observability
1. What needs to exist before we add the example?
Use an existing, managed-identity AKS cluster with Linux amd64 capacity, OIDC and Workload Identity enabled, an established Terraform pipeline with configured AzureRM, AzAPI and Helm providers, and working kubectl access to that cluster.
The workspaces, Application Insights, collection rules and dedicated identities are created by the example, rather than supplied as preprovisioned prerequisites.
The pipeline needs permission to create monitoring resources, identities and scoped role assignments, read AKS ARM properties and write DCR associations at AKS scope, plus Kubernetes access for Helm. Contributor alone cannot create role assignments. Changes to AKS use its existing deployment permissions and Terraform configuration; do not import the cluster into another state.
Use one Azure public-cloud region for AKS and the monitoring resources. Check native OTLP and Application Insights availability there, and register the required Azure resource providers through your existing subscription setup.
The pipeline needs network access to the Kubernetes API, provider/chart registries and its state backend. Workloads need image-registry access and the relevant Azure ingestion, Prometheus query and Entra endpoints. Grafana downloads its pinned plugin from Grafana’s catalog during startup; restricted environments need an approved preinstalled image or mirror. The example uses authenticated public telemetry endpoints, not Private Link/AMPLS or a cross-region design.
Use a dedicated demo namespace for Podinfo and observability for the Collector and Grafana after checking existing use. The local Grafana login Secret is created before Helm as shown below; no Azure credential goes in that Secret.
Keep all new resources in one configuration
The companion repository groups the observability additions for use with your existing Terraform code. The commands below use this directory layout:
| Location | Purpose |
|---|---|
observability/ |
Creates the Azure Monitor workspace, Log Analytics, Application Insights, DCEs/DCRs/associations, dedicated identities/federations/roles and both Helm releases. |
| Existing AKS Terraform configuration | Keeps the cluster resource and its OIDC, Workload Identity, managed-metrics and Container insights settings. |
aks-settings/ |
Small snippets to merge into that existing configuration, not another deployable root. |
podinfo/ and native/ |
Demo workload and one custom scrape job, applied through the existing Kubernetes deployment process. |
Before changing anything, inspect the selected cluster and its current DCR associations. These commands use your existing working kubectl access. Set AKS_ID and KUBE_CONTEXT for the same intended cluster; KUBE_CONTEXT selects the cluster for these shell commands, not Terraform provider authentication. The :?required checks stop these commands if either variable is unset:
steps/01-inspect.sh:
: "${AKS_ID:?required}" "${KUBE_CONTEXT:?required}"
az aks show --ids "$AKS_ID"   --query '{id:id,identity:identity,metrics:azureMonitorProfile.metrics,logs:addonProfiles.omsagent,oidc:oidcIssuerProfile,workloadIdentity:securityProfile.workloadIdentity}'
az monitor data-collection rule association list-by-resource --resource "$AKS_ID"
kubectl --context "$KUBE_CONTEXT" -n kube-system get pods
If monitoring already serves other workloads, reconcile its destinations and rules first. This example creates a new installation; it does not migrate shared monitoring or add a duplicate collection path.
OIDC and Workload Identity must be enabled before installing the federated workloads. If they are not, merge these properties inside the existing AKS resource and apply that configuration first, keeping its resource address and unrelated settings:
aks-settings/identity.hcl:
# Merge INSIDE the existing azurerm_kubernetes_cluster resource before observability.
# Preserve its resource address and every unrelated setting.
oidc_issuer_enabled       = true
workload_identity_enabled = true
Check compatibility with the existing cluster module/provider before changing it. This snippet does not create a cluster. [5]
The observability configuration reads AKS through a data source. It checks the identity prerequisites and uses the cluster’s region and issuer without retrieving cluster credentials:
observability/existing.tf:
data "azurerm_resource_group" "monitoring" {
  name = var.resource_group_name
}
# Read only: AKS remains managed by its existing Terraform configuration.
# Read ARM properties, not cluster credentials; Helm uses its existing provider configuration.
data "azapi_resource" "aks" {
  type      = "Microsoft.ContainerService/managedClusters@2024-10-01"
  name      = var.aks_name
  parent_id = "/subscriptions/${var.subscription_id}/resourceGroups/${var.aks_resource_group_name}"
  response_export_values = [
    "properties.oidcIssuerProfile",
    "properties.securityProfile.workloadIdentity"
  ]
  lifecycle {
    postcondition {
      condition = try(
        self.output.properties.oidcIssuerProfile.enabled == true &&
        startswith(self.output.properties.oidcIssuerProfile.issuerURL, "https://") &&
        self.output.properties.securityProfile.workloadIdentity.enabled == true,
        false
      )
      error_message = "Enable OIDC and Workload Identity in the existing AKS configuration before applying observability."
    }
  }
}
There is one small link back to the cluster configuration: Container insights needs the new Log Analytics workspace ID. The order is therefore existing OIDC/Workload Identity → apply observability → enable the native monitoring add-ons in the existing AKS configuration. The last step uses one workspace-ID output; Helm needs no exported input file. The complete apply sequence appears after the Collector and Grafana configuration below.
Create the destinations and the native OTLP route
The first resources are the two different workspace types and workspace-based Application Insights:
observability/backends.tf:
resource "azurerm_monitor_workspace" "metrics" {
  name                          = "${var.name}-metrics"
  resource_group_name           = var.resource_group_name
  location                      = data.azapi_resource.aks.location
  public_network_access_enabled = true
}
resource "azurerm_log_analytics_workspace" "logs" {
  name                = "${var.name}-logs"
  resource_group_name = var.resource_group_name
  location            = data.azapi_resource.aks.location
  sku                 = "PerGB2018"
  retention_in_days   = 30
}
# Manual OTLP orchestration: ordinary workspace-based AI; do not enable
# automatic OTLP workspace creation in the portal as a second onboarding path.
resource "azurerm_application_insights" "traces" {
  name                         = "${var.name}-traces"
  resource_group_name          = var.resource_group_name
  location                     = data.azapi_resource.aks.location
  workspace_id                 = azurerm_log_analytics_workspace.logs.id
  application_type             = "other"
  retention_in_days            = 30
  local_authentication_enabled = false
}
Use Microsoft’s manual resource orchestration path: create workspace-based Application Insights with automatic OTLP provisioning Off, then associate it through the DCR below. [2]
AzAPI supplies the native OTLP DCR fields that AzureRM does not expose. This is a direct-traces-only version of Microsoft’s template: all three trace streams, Log Analytics and Application Insights enrichment, without the unused AMA, logs and metrics flows. [27] · [29]
observability/otlp.tf:
# Narrowed from Microsoft's OTLP_DCE_DCR_ARM_Template.txt:
# direct Collector traces only; keep all three trace streams and AI enrichment.
# These native OTLP fields are absent from AzureRM 5.12.0; use the documented ARM API.
# Keep AzAPI schema validation enabled; no live ARM preflight is part of local tests.
resource "azapi_resource" "trace_dce" {
  type      = "Microsoft.Insights/dataCollectionEndpoints@2024-03-11"
  name      = "${var.name}-otlp"
  parent_id = data.azurerm_resource_group.monitoring.id
  location  = data.azapi_resource.aks.location
  body = {
    properties = {
      description = "Direct OTLP trace ingestion"
      networkAcls = { publicNetworkAccess = "Enabled" }
    }
  }
  response_export_values = ["properties.logsIngestion.endpoint"]
}
locals {
  trace_streams = [
    "Microsoft-OTel-Traces-Spans",
    "Microsoft-OTel-Traces-Events",
    "Microsoft-OTel-Traces-Resources"
  ]
}
resource "azapi_resource" "trace_dcr" {
  type                      = "Microsoft.Insights/dataCollectionRules@2024-03-11"
  name                      = "${var.name}-otlp"
  parent_id                 = data.azurerm_resource_group.monitoring.id
  location                  = data.azapi_resource.aks.location
  schema_validation_enabled = true
  body = {
    properties = {
      description              = "Direct OTLP traces with Application Insights association"
      dataCollectionEndpointId = azapi_resource.trace_dce.id
      references = {
        applicationInsights = [{
          resourceId = azurerm_application_insights.traces.id
          name       = "applicationInsightsResource"
        }]
      }
      directDataSources = {
        otelTraces = [{
          streams                        = local.trace_streams
          enrichWithResourceAttributes   = ["*"]
          enrichWithReference            = "applicationInsightsResource"
          replaceResourceIdWithReference = true
          name                           = "otelTracesDataSourceDirect"
        }]
      }
      destinations = {
        logAnalytics = [{
          workspaceResourceId = azurerm_log_analytics_workspace.logs.id
          name                = "myLAW"
        }]
      }
      dataFlows = [{ streams = local.trace_streams, destinations = ["myLAW"] }]
    }
  }
  response_export_values = ["properties.immutableId"]
}
locals {
  trace_endpoint = "${trimsuffix(azapi_resource.trace_dce.output.properties.logsIngestion.endpoint, "/")}/datacollectionRules/${azapi_resource.trace_dcr.output.properties.immutableId}/streams/Microsoft-OTLP-Traces/otlp/v1/traces"
}
The full Collector URL is derived from the DCE’s returned logs ingestion endpoint and the DCR’s returned immutable ID. The DCR’s Azure resource ID is used for RBAC, not in that URL. The Application Insights reference associates native spans with the component; it does not convert them into classic AppTraces. No endpoint or resource ID needs to be copied from the portal.
The same configuration creates the native Prometheus DCE/DCR and ContainerInsights DCR and associates both rules with the existing AKS resource. Their configuration follows below. Creating these associations does not itself enable the native agents; their AKS settings are applied after the new workspace exists. [1]
2. Give each identity one clear job
The pipeline deploys resources, native add-ons collect telemetry, the Collector's workload identity writes traces, and Grafana reads metrics. These are different principals with different scopes; they should not share one deployment credential.
| Identity | Responsibility |
|---|---|
| Pipeline Azure identity | Create the monitoring resources, dedicated identities/federations, scoped roles and Helm releases. Update AKS through its existing configuration; the supplied example shows that apply separately. |
| AKS control-plane/cluster identity | Existing cluster operations; current Container insights managed-identity authentication uses this identity. |
| Kubelet identity | Existing node responsibilities such as registry access; not a blanket grant for the Collector. |
| Native metrics ingestion identity | Managed by the native AKS metrics add-on during onboarding. Do not substitute the Grafana reader or Collector identity. |
| Collector user-assigned identity | Federated to one Kubernetes service account; Monitoring Metrics Publisher on the trace DCR. |
| Grafana user-assigned identity | Federated only to observability:grafana; Monitoring Data Reader on the Azure Monitor workspace, not trace-ingestion rights. |
| Human investigator | Access to the intended Log Analytics workspaces and Application Insights experience; separate from the agent and Grafana roles. |
Current Container insights managed-identity authentication does not require adding Monitoring Metrics Publisher to the cluster. The Collector's direct OTLP route does require that role on its DCR. [2] · [8] · [9]
The observability/ directory groups the new monitoring resources and Helm releases for your existing Terraform setup. Add these files to the root where your AzureRM, AzAPI and Helm providers are already configured, keeping their existing subscription, tenant and cluster settings. If you run this directory separately, reuse the provider configuration there too; it is not inherited from another folder. versions.tf declares only the required provider packages and versions.
observability/versions.tf:
terraform {
  required_version = ">= 1.10.0, < 2.0.0"
  required_providers {
    azurerm = { source = "hashicorp/azurerm", version = "5.12.0" }
    azapi   = { source = "Azure/azapi", version = "2.13.0" }
    helm    = { source = "hashicorp/helm", version = "3.3.0" }
  }
  # Reuse the existing Terraform setup and provider configurations.
}
Supply the existing subscription, tenant, resource-group and AKS names. New endpoints and identity IDs are direct resource references, not inputs to copy:
observability/terraform.tfvars.example:
name                      = "store-observability"
subscription_id           = "00000000-0000-4000-8000-000000000000"
tenant_id                 = "22222222-2222-4222-8222-222222222222"
resource_group_name       = "existing-monitoring-rg"
aks_name                  = "existing-aks"
aks_resource_group_name   = "existing-aks-rg"
grafana_admin_secret_name = "grafana-admin"
The variable declarations are in observability/variables.tf. grafana_admin_secret_name identifies an existing Kubernetes Secret; its value is a name, not a password.
The two identities receive separate federations and grants:
observability/identity.tf:
resource "azurerm_user_assigned_identity" "traces" {
  name                = "${var.name}-traces"
  resource_group_name = var.resource_group_name
  location            = data.azapi_resource.aks.location
}
resource "azurerm_federated_identity_credential" "traces" {
  name                      = "podinfo-collector"
  user_assigned_identity_id = azurerm_user_assigned_identity.traces.id
  audience                  = ["api://AzureADTokenExchange"]
  issuer                    = data.azapi_resource.aks.output.properties.oidcIssuerProfile.issuerURL
  subject                   = "system:serviceaccount:observability:otel-collector"
}
resource "azurerm_role_assignment" "trace_ingestion" {
  scope                = azapi_resource.trace_dcr.id
  role_definition_name = "Monitoring Metrics Publisher"
  principal_id         = azurerm_user_assigned_identity.traces.principal_id
}
resource "azurerm_user_assigned_identity" "grafana" {
  name                = "${var.name}-grafana"
  resource_group_name = var.resource_group_name
  location            = data.azapi_resource.aks.location
}
resource "azurerm_federated_identity_credential" "grafana" {
  name                      = "${var.name}-grafana"
  user_assigned_identity_id = azurerm_user_assigned_identity.grafana.id
  audience                  = ["api://AzureADTokenExchange"]
  issuer                    = data.azapi_resource.aks.output.properties.oidcIssuerProfile.issuerURL
  subject                   = "system:serviceaccount:observability:grafana"
}
resource "azurerm_role_assignment" "grafana_metrics" {
  scope                = azurerm_monitor_workspace.metrics.id
  role_definition_name = "Monitoring Data Reader"
  principal_id         = azurerm_user_assigned_identity.grafana.principal_id
}
The federation matches the exact issuer, service-account subject and api://AzureADTokenExchange audience. Its client ID identifies the workload identity; the role assignments use principal/object IDs. The pinned provider uses user_assigned_identity_id, not older parent_id examples. [10]
The new Grafana identity has its own federation and workspace-scoped reader assignment. Its service-account subject is system:serviceaccount:observability:grafana; it does not reuse the Collector identity or the node identity. The service-account annotation receives the client ID, while Azure role assignments receive the principal/object ID. Broader inherited access is not narrowed by this assignment. [11]
3. Let the native metrics agent own the scrape
Add one Podinfo job to the replica-level ama-metrics-prometheus-config ConfigMap. Do not also enable annotation scraping, a PodMonitor/ServiceMonitor or a Collector Prometheus receiver for the same endpoint.
Save this as native/prometheus-config, without a file extension:
scrape_configs:
  - job_name: podinfo
    scrape_interval: 15s
    scrape_timeout: 10s
    metrics_path: /metrics
    static_configs:
      - targets: [podinfo.demo.svc.cluster.local:9898]
The native add-on consumes the prometheus-config key from ama-metrics-prometheus-config in kube-system. This is different from ama-metrics-settings-configmap, which controls defaults and other agent settings. Do not place this Service target in the per-node ConfigMap: that would make every node scrape it. [12]
Inspect the existing configuration first:
kubectl --context "$KUBE_CONTEXT" -n kube-system get configmap ama-metrics-prometheus-config -o yaml
If it exists, merge this job through its existing deployment process without deleting other jobs. If it does not exist and creation is approved, create it once:
kubectl --context "$KUBE_CONTEXT" -n kube-system create configmap ama-metrics-prometheus-config --from-file=prometheus-config=native/prometheus-config
The create operation refuses an existing object rather than replacing it. Preserve this configuration in the existing deployment process after the exercise. Check the agent's config-processing logs and target status if it rejects the job; Microsoft's promconfigvalidator is shipped inside the managed agent for validating its exact accepted configuration.
This Service-based target deliberately uses one Podinfo replica. A Service can route successive scrapes to different replicas; that does not produce trustworthy per-process counter histories. Adopt per-pod discovery and explicit ownership before scaling. The native add-on's own built-in targets remain under their existing configuration.
4. Keep container logs on the Container insights path
Container insights collects Podinfo's stderr and stores it in ContainerLogV2. Keep the JSON message and its trace ID intact. Do not add Fluent Bit or a Collector log pipeline alongside this route.
The observability configuration creates the complete native rules and associations, not a fragment that assumes they already exist. Its Prometheus forwarder routes to the new Azure Monitor workspace; its ContainerInsights extension routes only Microsoft-ContainerLogV2 to the new Log Analytics workspace. It does not enable the full inventory/performance stream set required by every Container insights dashboard. [31] · [32]
observability/native.tf:
resource "azurerm_monitor_data_collection_endpoint" "metrics" {
  name                          = "${var.name}-prometheus"
  resource_group_name           = var.resource_group_name
  location                      = data.azapi_resource.aks.location
  kind                          = "Linux"
  public_network_access_enabled = true
}
resource "azurerm_monitor_data_collection_rule" "metrics" {
  name                        = "${var.name}-prometheus"
  resource_group_name         = var.resource_group_name
  location                    = data.azapi_resource.aks.location
  kind                        = "Linux"
  data_collection_endpoint_id = azurerm_monitor_data_collection_endpoint.metrics.id
  destinations {
    monitor_account {
      monitor_account_id = azurerm_monitor_workspace.metrics.id
      name               = "MonitoringAccount1"
    }
  }
  data_flow {
    streams      = ["Microsoft-PrometheusMetrics"]
    destinations = ["MonitoringAccount1"]
  }
  data_sources {
    prometheus_forwarder {
      streams = ["Microsoft-PrometheusMetrics"]
      name    = "PrometheusDataSource"
    }
  }
}
resource "azurerm_monitor_data_collection_rule_association" "metrics" {
  name                    = "${var.name}-prometheus"
  target_resource_id      = data.azapi_resource.aks.id
  data_collection_rule_id = azurerm_monitor_data_collection_rule.metrics.id
}
resource "azurerm_monitor_data_collection_rule" "logs" {
  name                = "${var.name}-container-insights"
  resource_group_name = var.resource_group_name
  location            = data.azapi_resource.aks.location
  destinations {
    log_analytics {
      workspace_resource_id = azurerm_log_analytics_workspace.logs.id
      name                  = "ciworkspace"
    }
  }
  data_sources {
    extension {
      name           = "ContainerInsightsExtension"
      extension_name = "ContainerInsights"
      streams        = ["Microsoft-ContainerLogV2"]
      extension_json = jsonencode({
        dataCollectionSettings = {
          interval               = "1m"
          namespaceFilteringMode = "Off"
          namespaces             = []
          enableContainerLogV2   = true
        }
      })
    }
  }
  data_flow {
    streams       = ["Microsoft-ContainerLogV2"]
    destinations  = ["ciworkspace"]
    transform_kql = "source"
  }
}
resource "azurerm_monitor_data_collection_rule_association" "logs" {
  name                    = "ContainerInsightsExtension"
  target_resource_id      = data.azapi_resource.aks.id
  data_collection_rule_id = azurerm_monitor_data_collection_rule.logs.id
}
There is only one native rule for each signal path. If adapting an existing shared installation, preserve its required streams and destinations rather than installing these associations alongside its existing ones.
source preserves the incoming events. This matters because our correlation event is debug-level, not error-level. A filter that keeps only error and critical would discard the request-start event even when its eventual response is HTTP 500. If the rule currently uses Microsoft-ContainerInsights-Group-Default, expand it into the required individual streams before defining a separate transformed flow; do not collect the group and the same explicit stream twice. [13]
The DCR's namespaceFilteringMode is not an inclusion filter for ContainerLogV2 stdout/stderr. Agent-side namespace exclusions are configured through container-azm-ms-agentconfig; verify that stderr collection is enabled and demo is not excluded. Merge any required changes into the shared ConfigMap, preserving its other settings. A DCR transformation can filter PodNamespace after transport, but it is not the same as preventing collection at the agent. [14]
For this exercise, preserve any existing shared agent collection policy and query only demo. The new workspace starts with 30-day retention. Choose any dedicated ingestion filter, different retention period or Basic-versus-Analytics table plan separately.
5. Install a traces-only Collector with Helm
The Collector accepts gRPC inside the cluster and exports HTTPS HTTP/protobuf to the native OTLP endpoint created in the same configuration. Microsoft Entra Workload ID supplies its projected token. The Collector has no metrics or logs pipeline.
observability/helm.tf:
resource "helm_release" "collector" {
  name             = "otel-collector"
  namespace        = "observability"
  create_namespace = false
  repository       = "https://open-telemetry.github.io/opentelemetry-helm-charts"
  chart            = "opentelemetry-collector"
  version          = "0.176.1"
  values = [templatefile("${path.module}/collector.yaml.tftpl", {
    client_id      = azurerm_user_assigned_identity.traces.client_id
    tenant_id      = var.tenant_id
    trace_endpoint = local.trace_endpoint
  })]
  depends_on = [
    azurerm_federated_identity_credential.traces,
    azurerm_role_assignment.trace_ingestion
  ]
  wait    = true
  timeout = 600
}
observability/collector.yaml.tftpl:
fullnameOverride: otel-collector
mode: deployment
replicaCount: 1
rollout: {strategy: Recreate, rollingUpdate: {}}
autoscaling: {enabled: false}
image: {repository: otel/opentelemetry-collector-contrib, tag: '0.162.0'}
command: {name: otelcol-contrib}
nodeSelector:
  kubernetes.io/os: linux
  kubernetes.io/arch: amd64
serviceAccount:
  create: true
  name: otel-collector
  automountServiceAccountToken: false
  annotations:
    azure.workload.identity/client-id: '${client_id}'
    azure.workload.identity/tenant-id: '${tenant_id}'
podLabels:
  azure.workload.identity/use: 'true'
clusterRole: {create: false}
presets:
  logsCollection: {enabled: false}
  hostMetrics: {enabled: false}
  kubernetesAttributes: {enabled: false}
  kubeletMetrics: {enabled: false}
  kubernetesEvents: {enabled: false}
  kubernetesObjects: {enabled: false}
  clusterMetrics: {enabled: false}
  annotationDiscovery: {logs: {enabled: false}, metrics: {enabled: false}}
  profiling: {enabled: false}
  resourceDetection: {enabled: false}
resources:
  requests: {cpu: 100m, memory: 256Mi}
  limits: {memory: 512Mi}
ports:
  otlp: {enabled: true, containerPort: 4317, servicePort: 4317, hostPort: null}
  otlp-http: {enabled: false}
  jaeger-compact: {enabled: false}
  jaeger-thrift: {enabled: false}
  jaeger-grpc: {enabled: false}
  zipkin: {enabled: false}
  metrics: {enabled: false}
service: {enabled: true, type: ClusterIP}
config:
  extensions:
    azure_auth:
      workload_identity:
        client_id: '$${env:AZURE_CLIENT_ID}'
        tenant_id: '$${env:AZURE_TENANT_ID}'
        federated_token_file: '$${env:AZURE_FEDERATED_TOKEN_FILE}'
      scopes: ['https://monitor.azure.com/.default']
  receivers:
    jaeger: null
    zipkin: null
    prometheus: null
    otlp:
      protocols:
        grpc: {endpoint: '$${env:MY_POD_IP}:4317'}
        http: null
  processors:
    memory_limiter: {check_interval: 1s, limit_percentage: 75, spike_limit_percentage: 15}
    batch: {timeout: 5s, send_batch_size: 512, send_batch_max_size: 512}
  exporters:
    debug: null
    otlp_http/azure:
      traces_endpoint: '${trace_endpoint}'
      encoding: proto
      compression: none
      auth: {authenticator: azure_auth}
      sending_queue: {enabled: true, queue_size: 100, num_consumers: 1}
      retry_on_failure: {enabled: true, initial_interval: 1s, max_interval: 10s, max_elapsed_time: 60s}
  service:
    extensions: [health_check, azure_auth]
    pipelines:
      logs: null
      metrics: null
      traces: {receivers: [otlp], processors: [memory_limiter, batch], exporters: [otlp_http/azure]}
Keep the doubled dollar signs: Terraform's templatefile turns $${env:...} into ${env:...}, which the Collector expands at runtime. The Helm provider downloads the chart from its repository.
The azure.workload.identity/use: "true" Pod label and service-account annotations cause the existing workload-identity webhook to project a federated token and inject the Azure identity environment variables. Ordinary Kubernetes API-token automount is disabled; the workload-identity projection is separate. Do not give Podinfo this identity. [15]
For contrib 0.162.0, azure_auth.workload_identity is the explicit authentication shape, and https://monitor.azure.com/.default is the requested scope. It is used on the outbound exporter, not to authenticate clients of the Collector's gRPC receiver. [16]
The complete values file removes the chart's unused default receivers and pipelines while retaining health_check for its probes. Podinfo’s Prometheus histogram is collected separately by the native metrics agent.
The release waits for its federation and DCR-scoped role assignment. This orders resource creation, but Azure authorization can still take time to propagate. Complete the Grafana configuration and apply sequence in the next section before checking the Collector rollout:
kubectl --context "$KUBE_CONTEXT" -n observability rollout status deployment/otel-collector --timeout=180s
kubectl --context "$KUBE_CONTEXT" -n observability logs deployment/otel-collector --tail=100
An authentication failure belongs to the trace path: inspect the Pod label, injected environment names, token-file mount, federation subject/issuer and DCR-scoped assignment. Do not print the token. Allow time for role propagation, then verify an incoming span in Azure.
6. Run Grafana CE on AKS and connect the metrics workspace
Like the EKS example, we deploy Grafana Community Edition (Grafana OSS) through Helm in the existing observability namespace. It runs behind a private ClusterIP Service, accessed through a local port-forward. The OSS image and the open-source Azure Prometheus plugin require no Enterprise licence.
Grafana 13 no longer provides Azure authentication through the core Prometheus datasource. The Azure Monitor Managed Service for Prometheus plugin supplies this integration with Workload Identity authentication. [11] · [17] · [18]
Supply the local admin Secret before Helm
Check whether observability already exists. Only if it is absent and creation is approved, run:
steps/00-namespace.sh:
# Only if observability is absent and its creation is approved. Refuses replacement.
: "${KUBE_CONTEXT:?required}"
kubectl --context "$KUBE_CONTEXT" create namespace observability
If grafana-admin already exists, confirm its keys and reuse it; do not overwrite another installation's credentials. For a new Secret, set GRAFANA_ADMIN_USER_FILE and GRAFANA_ADMIN_PASSWORD_FILE to approved local files containing the chosen username and password, without trailing newlines. Restrict access to those files and keep them out of Git, Terraform variables/state and shell tracing. The command passes file paths, not password values:
: "${KUBE_CONTEXT:?required}" "${GRAFANA_ADMIN_USER_FILE:?required}" "${GRAFANA_ADMIN_PASSWORD_FILE:?required}"
kubectl --context "$KUBE_CONTEXT" -n observability create secret generic grafana-admin \
  --from-file=admin-user="$GRAFANA_ADMIN_USER_FILE" \
  --from-file=admin-password="$GRAFANA_ADMIN_PASSWORD_FILE"
This create refuses an existing Secret. Helm consumes admin.existingSecret; it does not generate or embed an admin password in the example. Protect the Secret with the cluster's existing RBAC and encryption policy, and remove local credential files according to the existing credential-handling process. Azure queries use Grafana’s federated workload identity.
observability/grafana.tf:
resource "helm_release" "grafana" {
  name             = "grafana"
  namespace        = "observability"
  create_namespace = false
  repository       = "https://grafana-community.github.io/helm-charts"
  chart            = "grafana"
  version          = "14.0.1"
  values = [templatefile("${path.module}/grafana.yaml.tftpl", {
    client_id         = azurerm_user_assigned_identity.grafana.client_id
    tenant_id         = var.tenant_id
    query_url         = azurerm_monitor_workspace.metrics.query_endpoint
    admin_secret_name = var.grafana_admin_secret_name
  })]
  depends_on = [
    azurerm_federated_identity_credential.grafana,
    azurerm_role_assignment.grafana_metrics
  ]
  wait    = true
  timeout = 600
}
observability/grafana.yaml.tftpl:
fullnameOverride: grafana
replicas: 1
image:
  registry: docker.io
  repository: grafana/grafana
  tag: 13.2.4-distroless
nodeSelector:
  kubernetes.io/os: linux
  kubernetes.io/arch: amd64
serviceAccount:
  create: true
  name: grafana
  automountServiceAccountToken: false
  annotations:
    azure.workload.identity/client-id: '${client_id}'
    azure.workload.identity/tenant-id: '${tenant_id}'
podLabels:
  azure.workload.identity/use: 'true'
automountServiceAccountToken: false
rbac: {create: false}
admin:
  existingSecret: '${admin_secret_name}'
  userKey: admin-user
  passwordKey: admin-password
service: {type: ClusterIP}
ingress: {enabled: false}
persistence: {enabled: false}
testFramework: {enabled: false}
securityContext:
  runAsNonRoot: true
  runAsUser: 472
  runAsGroup: 472
  fsGroup: 472
resources:
  requests: {cpu: 100m, memory: 256Mi}
  limits: {memory: 512Mi}
grafana.ini:
  auth:
    azure_auth_enabled: true
  azure:
    cloud: AzureCloud
    managed_identity_enabled: false
    workload_identity_enabled: true
    forward_settings_to_plugins: grafana-azure-monitor-datasource, prometheus, grafana-azure-data-explorer-datasource, mssql, grafana-azureprometheus-datasource, grafana-databricks-datasource
plugins:
  - grafana-azureprometheus-datasource@1.0.10@https://grafana.com/api/plugins/grafana-azureprometheus-datasource/versions/1.0.10/download?os=linux&arch=amd64
shadowBundledPlugins: false
datasources:
  datasources.yaml:
    apiVersion: 1
    datasources:
      - name: Azure Prometheus
        uid: azure-prometheus
        type: grafana-azureprometheus-datasource
        access: proxy
        isDefault: true
        editable: false
        url: '${query_url}'
        jsonData:
          httpMethod: POST
          timeInterval: 15s
          manageAlerts: false
          oauthPassThru: false
          azureCredentials:
            authType: workloadidentity
The chart installs the pinned plugin synchronously through GF_PLUGINS_PREINSTALL_SYNC. azure_auth_enabled enables Azure datasource authentication; workload_identity_enabled enables federation, and forward_settings_to_plugins includes this plugin while retaining the pinned server's other defaults. No legacy prometheus_azure_auth feature toggle is needed. [19] · [20]
The Pod label and service-account annotations ask AKS's workload-identity webhook to inject AZURE_CLIENT_ID, AZURE_TENANT_ID and AZURE_FEDERATED_TOKEN_FILE, together with its projected token volume. The plugin's workload credential reads those values. Ordinary Kubernetes API-token automount remains disabled. Grafana runs as UID/GID 472 with fsGroup: 472; the projected token must be readable by that process. Inspect the admitted Pod's volume permissions if cluster policy changes them, without printing the token. Keep managed_identity_enabled disabled so authentication uses the projected workload token rather than node IMDS. [21] · [15]
Apply the configuration and enable native collection
With all files, the existing provider configuration and the Grafana Secret ready, use the existing pipeline to initialize, review and apply observability/. The plan creates the monitoring backends, rules, associations, dedicated identities and both Helm releases; it must not change or replace AKS. Helm receives its endpoints and client IDs directly from the resources above.
Read the single value needed by the existing AKS configuration, from the repository’s example/ directory:
steps/00-workspace-id.sh:
terraform -chdir=observability output -raw log_analytics_workspace_id
Pass that value through the cluster pipeline’s normal inputs as observability_log_analytics_workspace_id. Add this variable to the existing AKS configuration:
aks-settings/variables.tf.example:
# Add to the existing AKS configuration when enabling the monitoring add-ons.
variable "observability_log_analytics_workspace_id" {
  description = "log_analytics_workspace_id output from the observability configuration."
  type        = string
}
Then merge the following blocks inside its existing AKS resource and review/apply that configuration. Keep the OIDC and Workload Identity settings already enabled:
aks-settings/monitoring.hcl:
# Merge INSIDE the same existing AKS resource after observability has been applied.
monitor_metrics {
  annotations_allowed = null
  labels_allowed      = null
}
oms_agent {
  log_analytics_workspace_id      = var.observability_log_analytics_workspace_id
  msi_auth_for_monitoring_enabled = true
}
This enables the native metrics and Container insights agents against the prepared rules and destinations. Until this step, native metrics and container logs will not arrive. The native agents use AKS-managed authentication; do not reuse either Helm workload identity or add a blanket Publisher grant. [31] · [32] · [9]
Inspect the actual add-ons and associations again with steps/01-inspect.sh, then verify native ingestion. Do not run portal or CLI onboarding alongside these files: it can create another set of rules or destinations. If the workspace is replaced later, update the cluster’s input deliberately; the workspace and cluster settings remain linked.
Open Grafana and verify the datasource
Keep this port-forward running in a separate terminal:
kubectl --context "$KUBE_CONTEXT" -n observability rollout status deployment/grafana --timeout=180s
kubectl --context "$KUBE_CONTEXT" -n observability port-forward service/grafana 3000:80
Open http://localhost:3000 and sign in with the credentials supplied through grafana-admin. In Connections → Data sources, open Azure Prometheus and run Save & test. Its URL and Workload Identity authentication are provisioned from code; change that code rather than adding a second datasource. Verify the datasource against Azure, then run up{job="podinfo"} after generating traffic below.
For an authentication or startup failure, inspect the dedicated service account, admitted Pod and logs:
kubectl --context "$KUBE_CONTEXT" -n observability get serviceaccount grafana -o yaml
kubectl --context "$KUBE_CONTEXT" -n observability get pods -l app.kubernetes.io/instance=grafana -o yaml
kubectl --context "$KUBE_CONTEXT" -n observability logs deployment/grafana --tail=100
Check plugin installation, the workload label, injected environment names, token mount, exact issuer/subject/audience and the reader assignment on the intended workspace. Allow role propagation and verify DNS/HTTPS reachability to Entra and the query endpoint. Do not print bearer tokens or replace federation with a static client secret.
This single-replica lab disables persistence, as in the EKS example. Provisioned datasource configuration returns after replacement, but locally saved dashboards, users and other database changes do not; use versioned provisioning or persistent storage before retaining Grafana beyond the exercise. Restrict access with network policy and Kubernetes port-forward authorization.
Metrics are queried in Grafana, while logs and traces are investigated in Azure’s Log Analytics/Application Insights tools. Correlation uses a manual trace-ID lookup; automatic Grafana log-to-trace links can be added later.
7. Deploy upstream Podinfo separately
Podinfo supplies the request handler, metrics, logs and tracing without a Dockerfile or application build pipeline. Keep it private and use one replica; the pinned image is the same upstream release used for the EKS exercise.
Podinfo’s trace implementation uses an OTLP gRPC client. http:// below selects plaintext gRPC to port 4317; it does not mean OTLP/HTTP, and there is no /v1/traces suffix on this application endpoint. [22]
podinfo/podinfo.yaml:
apiVersion: v1
kind: Namespace
metadata: {name: demo}
---
apiVersion: apps/v1
kind: Deployment
metadata: {name: podinfo, namespace: demo}
spec:
  replicas: 1
  strategy: {type: Recreate}
  selector: {matchLabels: {app: podinfo}}
  template:
    metadata: {labels: {app: podinfo}}
    spec:
      automountServiceAccountToken: false
      enableServiceLinks: false
      nodeSelector: {kubernetes.io/os: linux, kubernetes.io/arch: amd64}
      securityContext: {runAsNonRoot: true, runAsUser: 10001, runAsGroup: 10001, fsGroup: 10001}
      containers:
        - name: podinfo
          image: ghcr.io/stefanprodan/podinfo:6.9.2@sha256:cab90e04829cdae73199a8402882a4e3ccaf251b8a0d50bdefede0ab3f6371e7
          command: [./podinfo]
          args: [--port=9898, --level=debug, --random-delay=false, --random-error=false]
          env:
            - {name: PODINFO_OTEL_SERVICE_NAME, value: podinfo}
            - name: OTEL_EXPORTER_OTLP_ENDPOINT
              value: http://otel-collector.observability.svc.cluster.local:4317
          ports: [{name: http, containerPort: 9898}]
          readinessProbe: {httpGet: {path: /readyz, port: http}}
          livenessProbe: {httpGet: {path: /healthz, port: http}, initialDelaySeconds: 5}
          resources:
            requests: {cpu: 100m, memory: 64Mi}
            limits: {cpu: 500m, memory: 128Mi}
          securityContext:
            allowPrivilegeEscalation: false
            readOnlyRootFilesystem: true
            capabilities: {drop: [ALL]}
          volumeMounts: [{name: data, mountPath: /data}]
      volumes: [{name: data, emptyDir: {sizeLimit: 16Mi}}]
---
apiVersion: v1
kind: Service
metadata: {name: podinfo, namespace: demo}
spec:
  type: ClusterIP
  selector: {app: podinfo}
  ports: [{name: http, port: 9898, targetPort: http}]
Review the namespace and resource names before applying through your approved context:
kubectl --context "$KUBE_CONTEXT" apply -f podinfo/podinfo.yaml
kubectl --context "$KUBE_CONTEXT" -n demo rollout status deployment/podinfo --timeout=180s
kubectl --context "$KUBE_CONTEXT" -n demo get pods -l app=podinfo
Podinfo exposes fault-injection and environment/configuration inspection endpoints. Do not put credentials or sensitive configuration in this demo, expose it through a public ingress, or give it a Kubernetes API token. Use the cluster’s enforced NetworkPolicies to restrict clients and access to the Collector’s port 4317 before broader use.
8. Follow a deliberate HTTP 500 across all three signals
Start with the response seen by the client, then check metrics, the request-start log and the matching server span.
Generate bounded traffic
Keep this port-forward running in a separate terminal:
kubectl --context "$KUBE_CONTEXT" -n demo port-forward service/podinfo 9898:9898
It binds locally by default. In another terminal, generate successful and failing requests for roughly a minute, allowing several scrapes:
for i in $(seq 1 30); do
  curl --fail --silent --show-error http://localhost:9898/status/200
  curl --silent --show-error --output /dev/null --write-out 'HTTP %{http_code}\n'     http://localhost:9898/status/500
  sleep 2
done
curl --fail --silent --show-error http://localhost:9898/delay/1
curl --fail --silent --show-error http://localhost:9898/metrics
Expect HTTP 500 from the deliberately failing endpoint. That curl command omits --fail intentionally. /delay/1 gives a separate slow request without introducing another service.
Find the metric signal
Select the intended Prometheus datasource in Grafana and a time range covering the requests. Run these queries separately: scrape health, missing scrape samples, request rate by response status and the fraction of status-route requests returning 5xx:
up{job="podinfo"}
absent_over_time(up{job="podinfo"}[5m])
sum by (status) (rate(http_request_duration_seconds_count{job="podinfo",path="status"}[5m]))
(
  sum(rate(http_request_duration_seconds_count{job="podinfo",path="status",status=~"5.."}[5m]))
  / sum(rate(http_request_duration_seconds_count{job="podinfo",path="status"}[5m]))
)
and (sum(rate(http_request_duration_seconds_count{job="podinfo",path="status"}[5m])) > 0)
If the workspace contains multiple clusters, add the intended cluster label to every selector after checking its actual value. Do not combine identical job="podinfo" series from unrelated clusters.
Podinfo's http_requests_total has only status as an application label. The http_request_duration_seconds histogram also has method and path; the named status route is path="status", not /status/500. Its _count series lets us exclude probes and scrape requests from the exercise's error fraction. [23]
up=1 indicates a successful scrape; the response-status rate queries show application errors. A missing up calls for checking the native agent, accepted configuration and workspace destination. up=0 calls for checking the target and reachability. The rate queries need several samples; the denominator guard suppresses the error fraction when the request rate is zero.
Find the request-start event in Log Analytics
Open Logs for the Container insights Log Analytics workspace, select the correct cluster/resource scope and run:
ContainerLogV2
| where TimeGenerated > ago(30m)
| where PodNamespace == "demo" and ContainerName == "podinfo"
| extend event = parse_json(tostring(LogMessage))
| where tostring(event.msg) == "request started"
| where tostring(event.uri) == "/status/500"
| project TimeGenerated, PodName,
          method = tostring(event.method),
          uri = tostring(event.uri), trace_id = tostring(event.trace_id)
| order by TimeGenerated desc
| take 20
If more than one cluster writes this namespace/container name to the workspace, also filter _ResourceId to the intended AKS resource ID. ContainerLogV2 provides the Kubernetes fields; LogMessage contains the application's event. parse_json(tostring(LogMessage)) gives us a consistent way to read its JSON fields. [24]
Copy one nonempty trace_id. These debug events describe request start, not response completion: they do not contain status or duration. Podinfo's logger can sample repeated events under load, so this is not an exhaustive access audit. [25]
If the query is empty, first inspect the application's own logs:
kubectl --context "$KUBE_CONTEXT" -n demo logs deployment/podinfo --tail=100
Then check --level=debug, tracing enablement, stderr exclusions, the DCR stream/destination and any transformations.
Look up the same trace ID in the Azure span store
Open Logs for the new Log Analytics workspace: this example sends container logs and traces to the same workspace. Replace the placeholder with the unchanged 32-hex trace ID from your own event:
let wanted_trace = "<32-hex-trace-id-from-the-request-log>";
OTelSpans
| where TimeGenerated > ago(30m)
| where TraceId == wanted_trace
| project TimeGenerated, TraceId, SpanId, ParentSpanId, Name, Kind,
          ServiceName, StatusCode, ResultCode,
          http_status = tostring(Attributes["http.response.status_code"]),
          DurationMs
| order by TimeGenerated asc
Native OTLP spans are stored in OTelSpans, with TraceId, SpanId, ParentSpanId, Kind, StatusCode and Attributes. Query TraceId using the unchanged value from Podinfo’s request-start event. [26]
For this pinned Podinfo version, the server span is named GET /status/{code:[0-9]+}. Inspect its HTTP result and error status; its child statusHandler span shares the trace ID but need not be marked as an error. A deliberate 500 does not require an exception event. The relevant server attribute is http.response.status_code=500.
The trace DCR associates these spans with the new Application Insights resource. Microsoft documents Search and Transaction details for OpenTelemetry investigation; inspect a trace sample there when that experience is available for your resource. The explicit lookup for this exercise remains the OTelSpans query above, and the portal experience has not been tested here. [3] · [30]
Do not expect complete Application Insights Performance/Failures dashboards or its prebuilt OTLP metric queries from this setup. Microsoft says those experiences expect delta OTLP metrics with exponential histograms. This Collector sends only traces; Podinfo’s Prometheus histogram stays on the native metrics path and is queried in Grafana. We do not add a duplicate metrics pipeline just to populate a dashboard. [2]
If no span appears, keep the same trace ID and check the trace destination, time window, Collector export errors, HTTP/protobuf endpoint and Entra authorization. Allow ingestion time and inspect an actual OTelSpans record before relying on a saved query or dashboard.
9. What should we keep, and what should we remove?
Keep the investigation path and resource boundaries. Remove only the example workload, scrape job and lab interfaces when finished; retain shared AKS monitoring and stored data according to the existing retention policy.
The single-replica Collector uses finite in-memory queues and retries; queued spans are lost if its process restarts. Its ClusterIP gRPC receiver is unauthenticated: any allowed client can send data that the Collector then authenticates to Azure. Restrict the receiver with enforced network policy and review TLS/client authentication for wider use.
Budget separately for managed Prometheus ingestion/storage/queries, Log Analytics ingestion/retention/scans, native OTLP data, and Grafana CE's AKS CPU/memory plus any persistent storage you later enable. Grafana CE carries no managed-Grafana service fee; include its operational maintenance in the budget. Review the new workspace’s 30-day retention and table plans before extending the lab. Debug logging is useful for the exercise but should not become an unreviewed cluster-wide collection policy.
Stop both local port-forwards, then delete only Podinfo's Deployment and Service:
kubectl --context "$KUBE_CONTEXT" -n demo delete deployment/podinfo service/podinfo
Remove only the podinfo scrape job, preserving every unrelated job. To remove Collector and Grafana while retaining the Azure backends, remove their two Helm release blocks from observability/ and review/apply that change. Do not destroy the whole configuration. After Grafana is gone, delete grafana-admin only if it was created exclusively for this exercise and is unused. Leave shared Secrets and namespaces in place; delete demo only if it contains no other resources and is no longer needed.
For an unused Secret created exclusively for this example:
kubectl --context "$KUBE_CONTEXT" -n observability delete secret grafana-admin
To retire the monitoring backends too, first remove dependent workloads and Helm releases. Disable only the dedicated monitoring add-on blocks in the existing AKS configuration and apply that change. Then review removal of the associations and remaining resources in observability/. Check shared consumers and retention/export requirements: deleting workspaces deletes stored telemetry. Keep OIDC/Workload Identity if other workloads use them; never destroy the AKS configuration or a shared resource group as tutorial cleanup.
Frequently asked questions
Why use Azure's native metrics and log agents instead of one Collector for everything?
They fit the requested managed Azure paths and avoid another independently operated log collector. Keeping the OpenTelemetry Collector focused on traces makes scrape ownership and troubleshooting explicit. An all-Collector architecture is another valid design, but it changes onboarding, identity and operational responsibilities.
Does enabling Container insights also give me managed Prometheus?
They are separate collection paths and destinations, even when the onboarding interface enables them together. Container logs go to Log Analytics; managed Prometheus samples go to an Azure Monitor workspace. Verify both add-ons, rules, associations and destinations.
Why does the log not say HTTP 500?
Podinfo emits a debug event when the request starts. It supplies the trace ID, URI and method, not the final response status. Use the client's response and matching server span to establish the outcome.
Can I keep the tooling and replace Podinfo with my own service?
Yes. Replace its scrape target, instrumentation and queries with your application's actual telemetry contract. Preserve one scrape owner, explicit log-to-trace correlation and scoped identities. Recheck discovery before scaling beyond this example's single Service target.
Sources
[3] Preview scope and limitations
[4] AKS-specific OTLP onboarding
[5] Pinned AKS provider schema
[6] DCR schema
[8] AKS identities
[9] Container insights authentication
[10] Pinned federation resource
[11] Grafana authentication and roles
[12] Custom scrape configuration
[13] DCR transformations
[15] Workload identity deployment
[16] Pinned Azure authentication extension
[17] Pinned plugin configuration
[18] Plugin compatibility
[21] Pinned workload credential implementation
[22] Podinfo tracer
[23] Pinned metrics implementation
[25] Logging middleware
[26] OTelSpans table reference
[27] Microsoft native OTLP manual-orchestration template, pinned revision
[28] OpenTelemetry options and path-specific availability status
[29] Native OTLP DCR ARM fields
[30] Application Insights transaction investigation
Frequently asked questions
What is observability in Azure AKS?
Observability in Azure AKS involves using metrics, logs, and traces to understand application behavior and diagnose issues. It helps identify request patterns, log specific events, and trace operations across services.
How do metrics, logs, and traces differ in Azure AKS?
Metrics provide time-based measurements like request counts. Logs record individual events with structured fields. Traces describe operations for a request, connecting work across services using context.
How are metrics collected in Azure AKS?
Azure's native agents collect Prometheus metrics, which are stored in an Azure Monitor workspace. The Azure Monitor metrics add-on scrapes metrics and sends them to the managed service.
What role does the OpenTelemetry Collector play in Azure AKS?
The OpenTelemetry Collector forwards traces from applications to Azure Monitor. It receives spans via OTLP/gRPC and exports them to Azure using HTTP/protobuf and Microsoft Entra authentication.
Can I use my own application instead of Podinfo in Azure AKS?
Yes, you can replace Podinfo with your own application. Ensure it provides compatible telemetry, and adapt the configuration for metrics, logs, and traces accordingly.
Why doesn't the log show HTTP 500 status?
Podinfo logs a debug event at request start, which includes the trace ID and URI but not the final response status. The HTTP 500 status is confirmed via client response and server span.
About the author
- I’m a hands-on technology architect, engineer and founder of Turing Technology Services, with nearly two decades of experience in software engineering, platform engineering, site reliability engineering and cloud infrastructure. My work combines architecture and implementation with technical leadership, coaching and helping organisations adopt new engineering practices. I’ve worked with organisations including Shell, ING, ABN AMRO, Rabobank, Schiphol Group and Ahold Delhaize, across complex and regulated enterprise environments. On this blog, I share practical guides and perspectives on software architecture, cloud platforms, reliability and AI, explaining the reasoning behind technical choices as well as how to implement them.
Observability
Understand what your systems are doing and why. Practical guides to metrics, logs and traces, from core concepts to hands-on implementations across cloud-native environments.