
SRE Fundamentals: Designing SLIs, SLOs and Error Budgets
Define a checkout attempt, measure usable responses, and decide when reliability work should take priority.
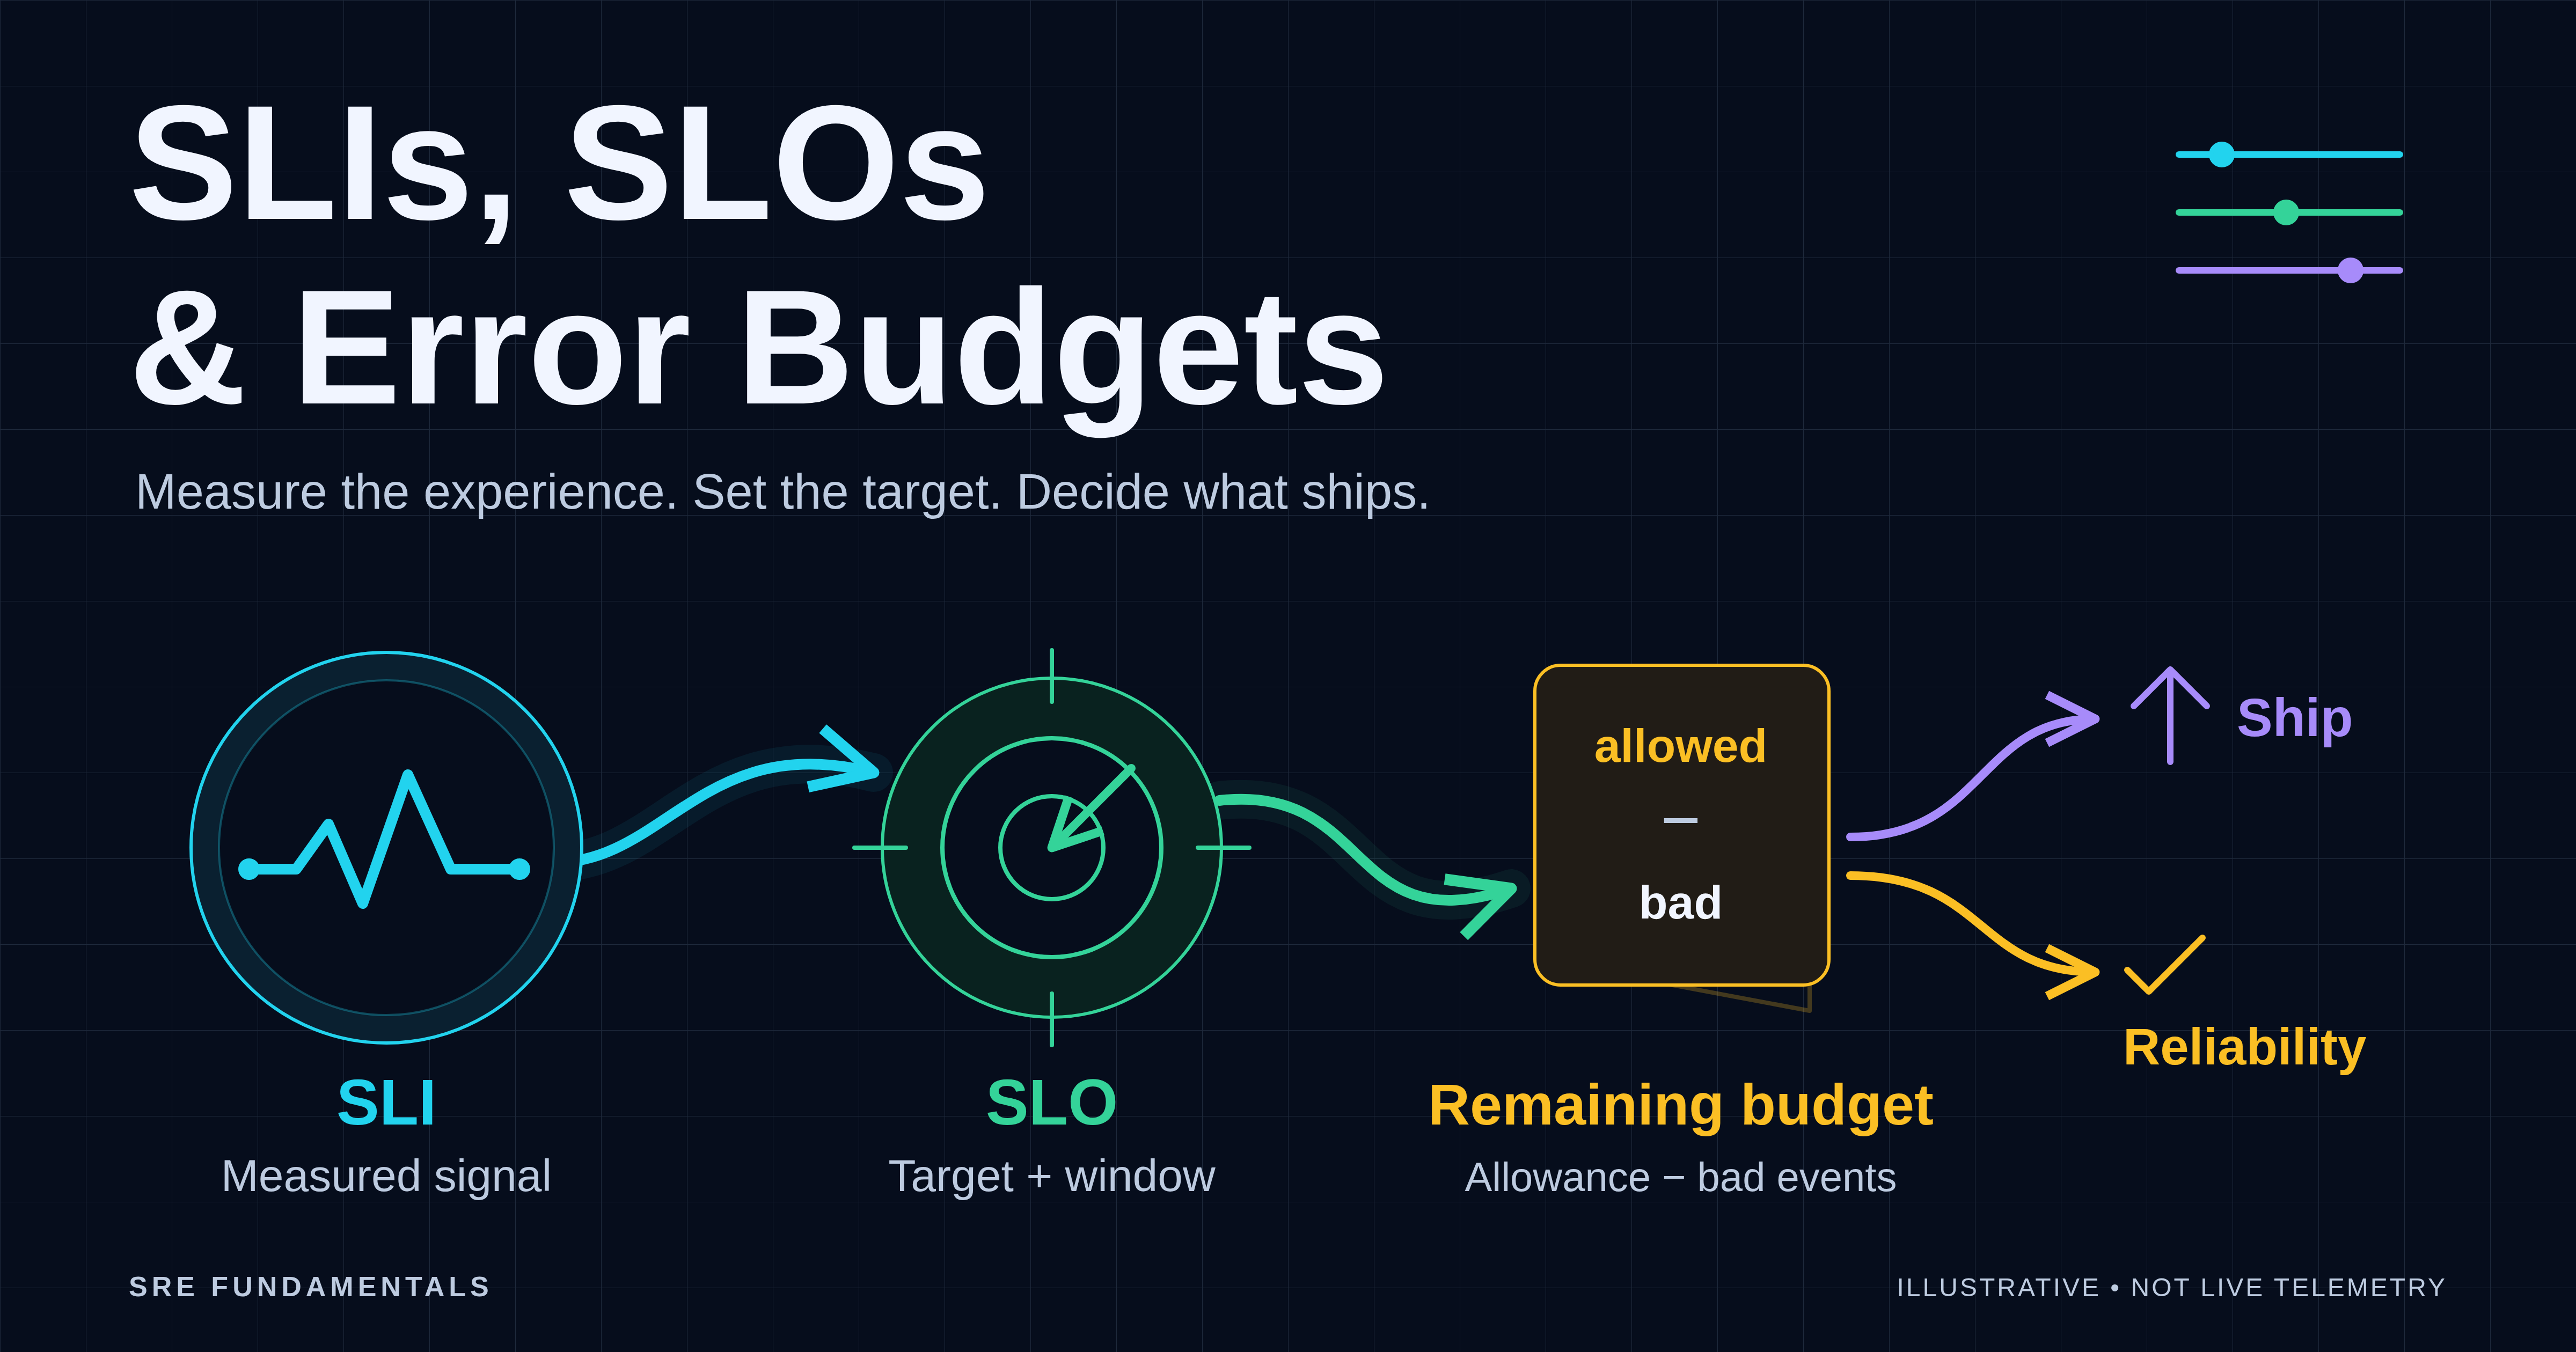
A green dashboard cannot tell you whether an online store's checkout is usable or whether the next sprint should fund features or reliability fixes. SLIs, SLOs and error budgets make that decision concrete. This guide defines one checkout attempt, measures availability and timely success, then turns the same traffic into an engineering policy.
Our example is a fictional online store. When a customer submits an order at checkout, the website calls a checkout API and waits for a result. We measure that API interaction—not the entire shopping journey, browser experience or every step of payment processing.
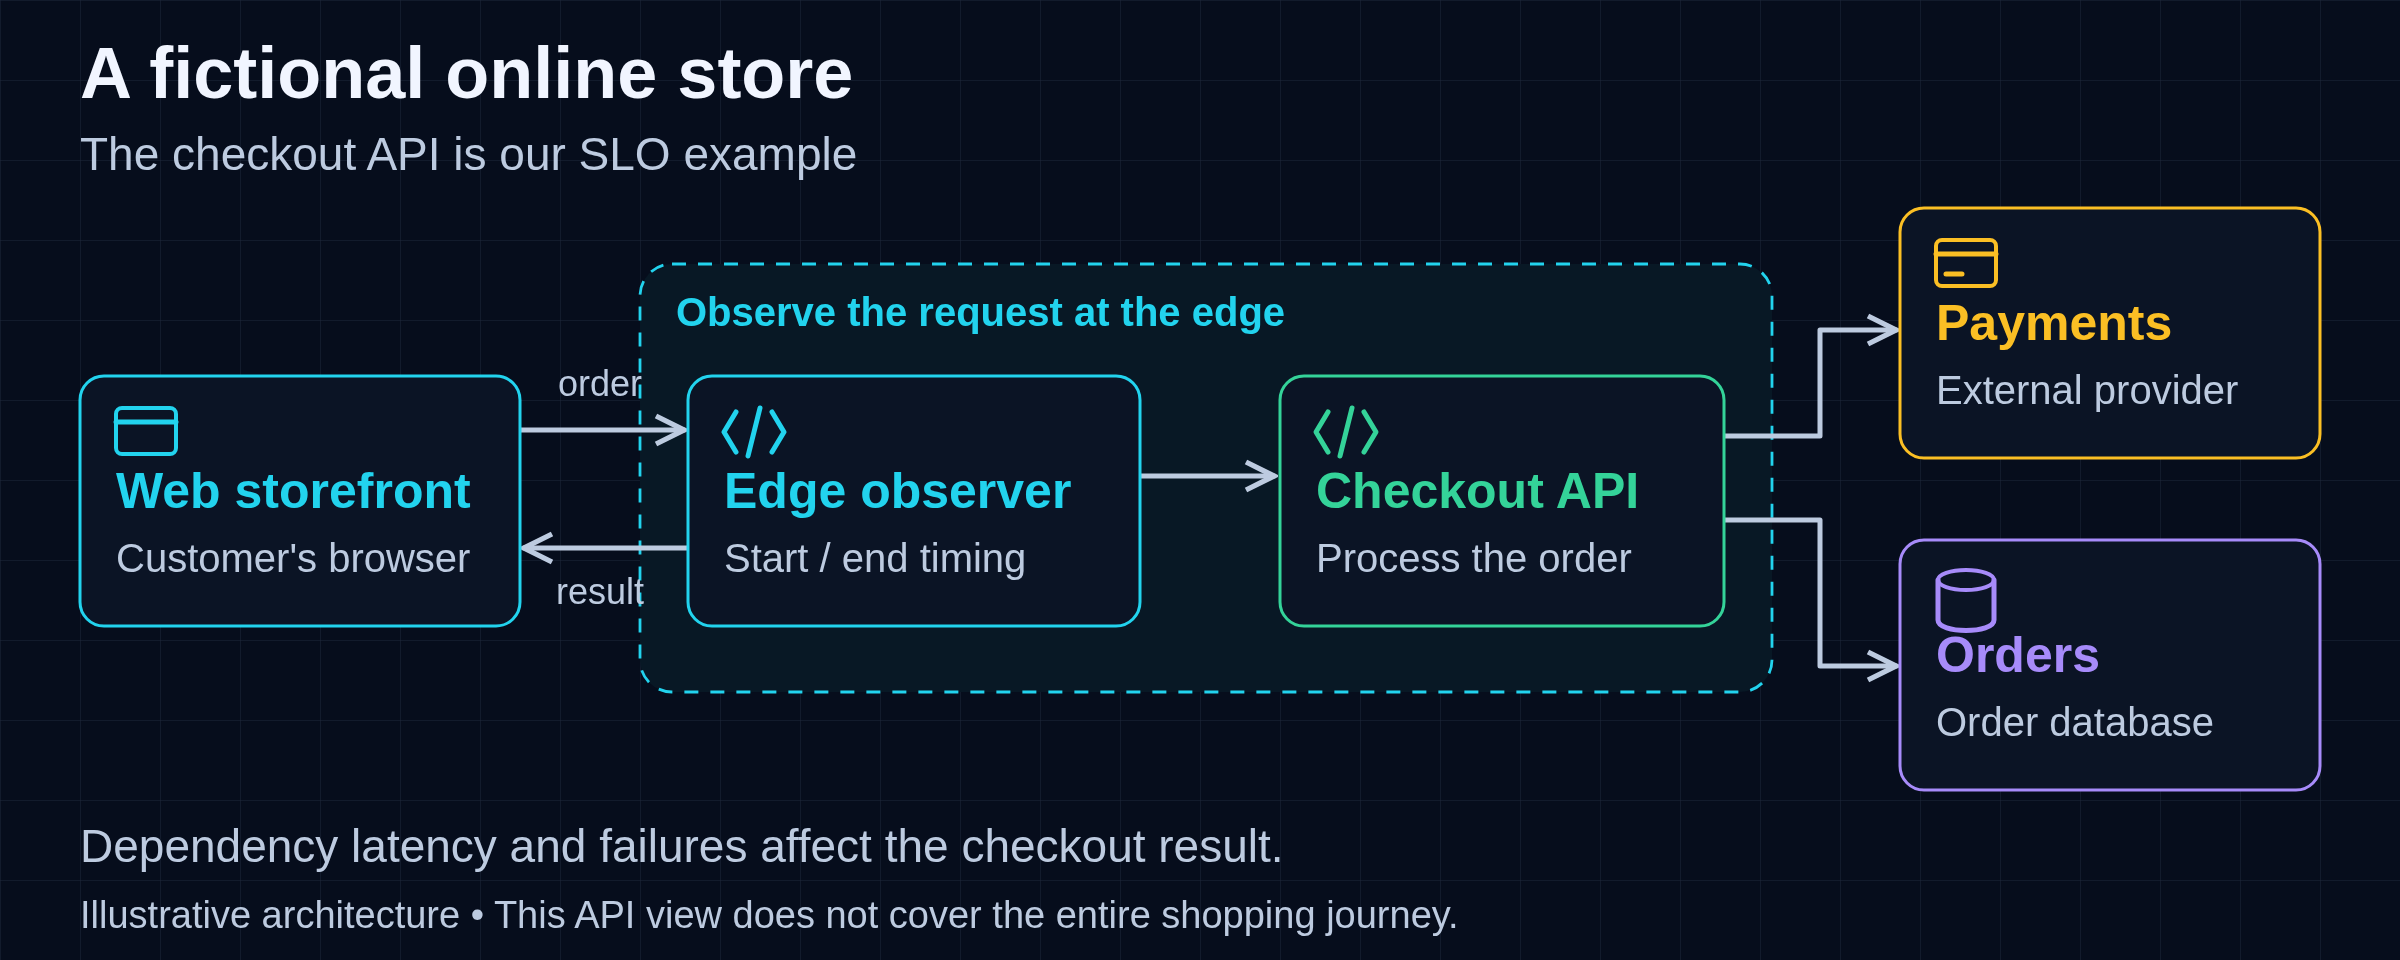
An illustrative online store. The edge observer measures the checkout request and its result, including the effects of downstream dependencies.
What do SLIs, SLOs and error budgets tell you?
An SLI (service level indicator) measures behaviour; an SLO (service level objective) sets its target over a window. An error budget quantifies the bad events that target allows, helping a team prioritize reliability work over discretionary changes.
CPU usage can explain why checkout struggles. It does not establish whether a customer received a usable response. Start with the user-facing operation, then choose a measurement that represents it. Google's service-level objectives chapter distinguishes these indicators and objectives from an SLA (service level agreement): an agreement with users that specifies consequences for meeting or missing its objectives.
For the hypothetical checkout API below, we will use two objectives:
- Availability: at least 99.9% of eligible attempts return a valid result.
- Timely success: at least 99.0% of eligible attempts return a valid result within 300 milliseconds.
Both use the same rolling 28-day window. These are teaching choices, not industry-standard targets. Product and engineering should choose real targets together, using user expectations and the cost of improving reliability.
The practical outcome is a measurement contract, two PromQL queries and a policy that changes engineering priorities. You need basic HTTP knowledge; the local exercise also requires promtool, the command-line tool distributed with Prometheus. It needs neither a running Prometheus server nor a deployed checkout service.
What counts as one checkout attempt?
Count one eligible external submission to POST /checkout, once, when it reaches a terminal outcome. An internal retry does not create another attempt. A new client submission does, even if it repeats an idempotency key. This measures attempts, not unique purchases or customers.
Define eligibility before classifying the outcome. Here, eligible attempts come from real production users with valid input and authorization. Exclude health probes, synthetic tests, staff or load-test traffic, malformed input and genuine authorization denials.
Keep authentication-infrastructure failures, capacity rejections of otherwise eligible requests, dependency failures and planned maintenance in scope. Filtering out every 4xx response would remove some real service failures. Changing exclusions after an incident would change the question instead of answering it.
Our hypothetical observer sits at the edge, where requests enter the service. It starts a timer on receipt and records exactly one terminal event at response completion, interruption or a two-second deadline. It must recognize eligible attempts even when the backend is unavailable. If it cannot establish eligibility or loses observations, investigate data coverage rather than silently removing those attempts.
A valid result is a semantically correct response delivered by the deadline: either an accepted checkout confirmation or a correctly handled business decline. A legitimate payment decline can therefore count as a service success, whereas a plausible-looking decline caused by a bug or dependency fault is a failed outcome under the contract. This SLI measures usable API handling, not sales conversion.
An infrastructure rejection is not a business decline; it counts as failed. Timeouts, interrupted responses or client disconnects, incorrect payloads and dependency failures also count as failed. Counting disconnects as failures is a conservative choice for this example. A response arriving after the deadline cannot convert the recorded failure into success.
Classify every eligible terminal event into exactly one category:
| Outcome | Meaning |
|---|---|
good |
Valid success completed in at most 300 ms |
slow |
Valid success completed after 300 ms, but by the two-second deadline |
failed |
Every other eligible terminal outcome |
Both measurements share total = good + slow + failed. Availability is (good + slow) / total; timely success is good / total. An attempt spanning the window boundary belongs to the window containing its terminal event.
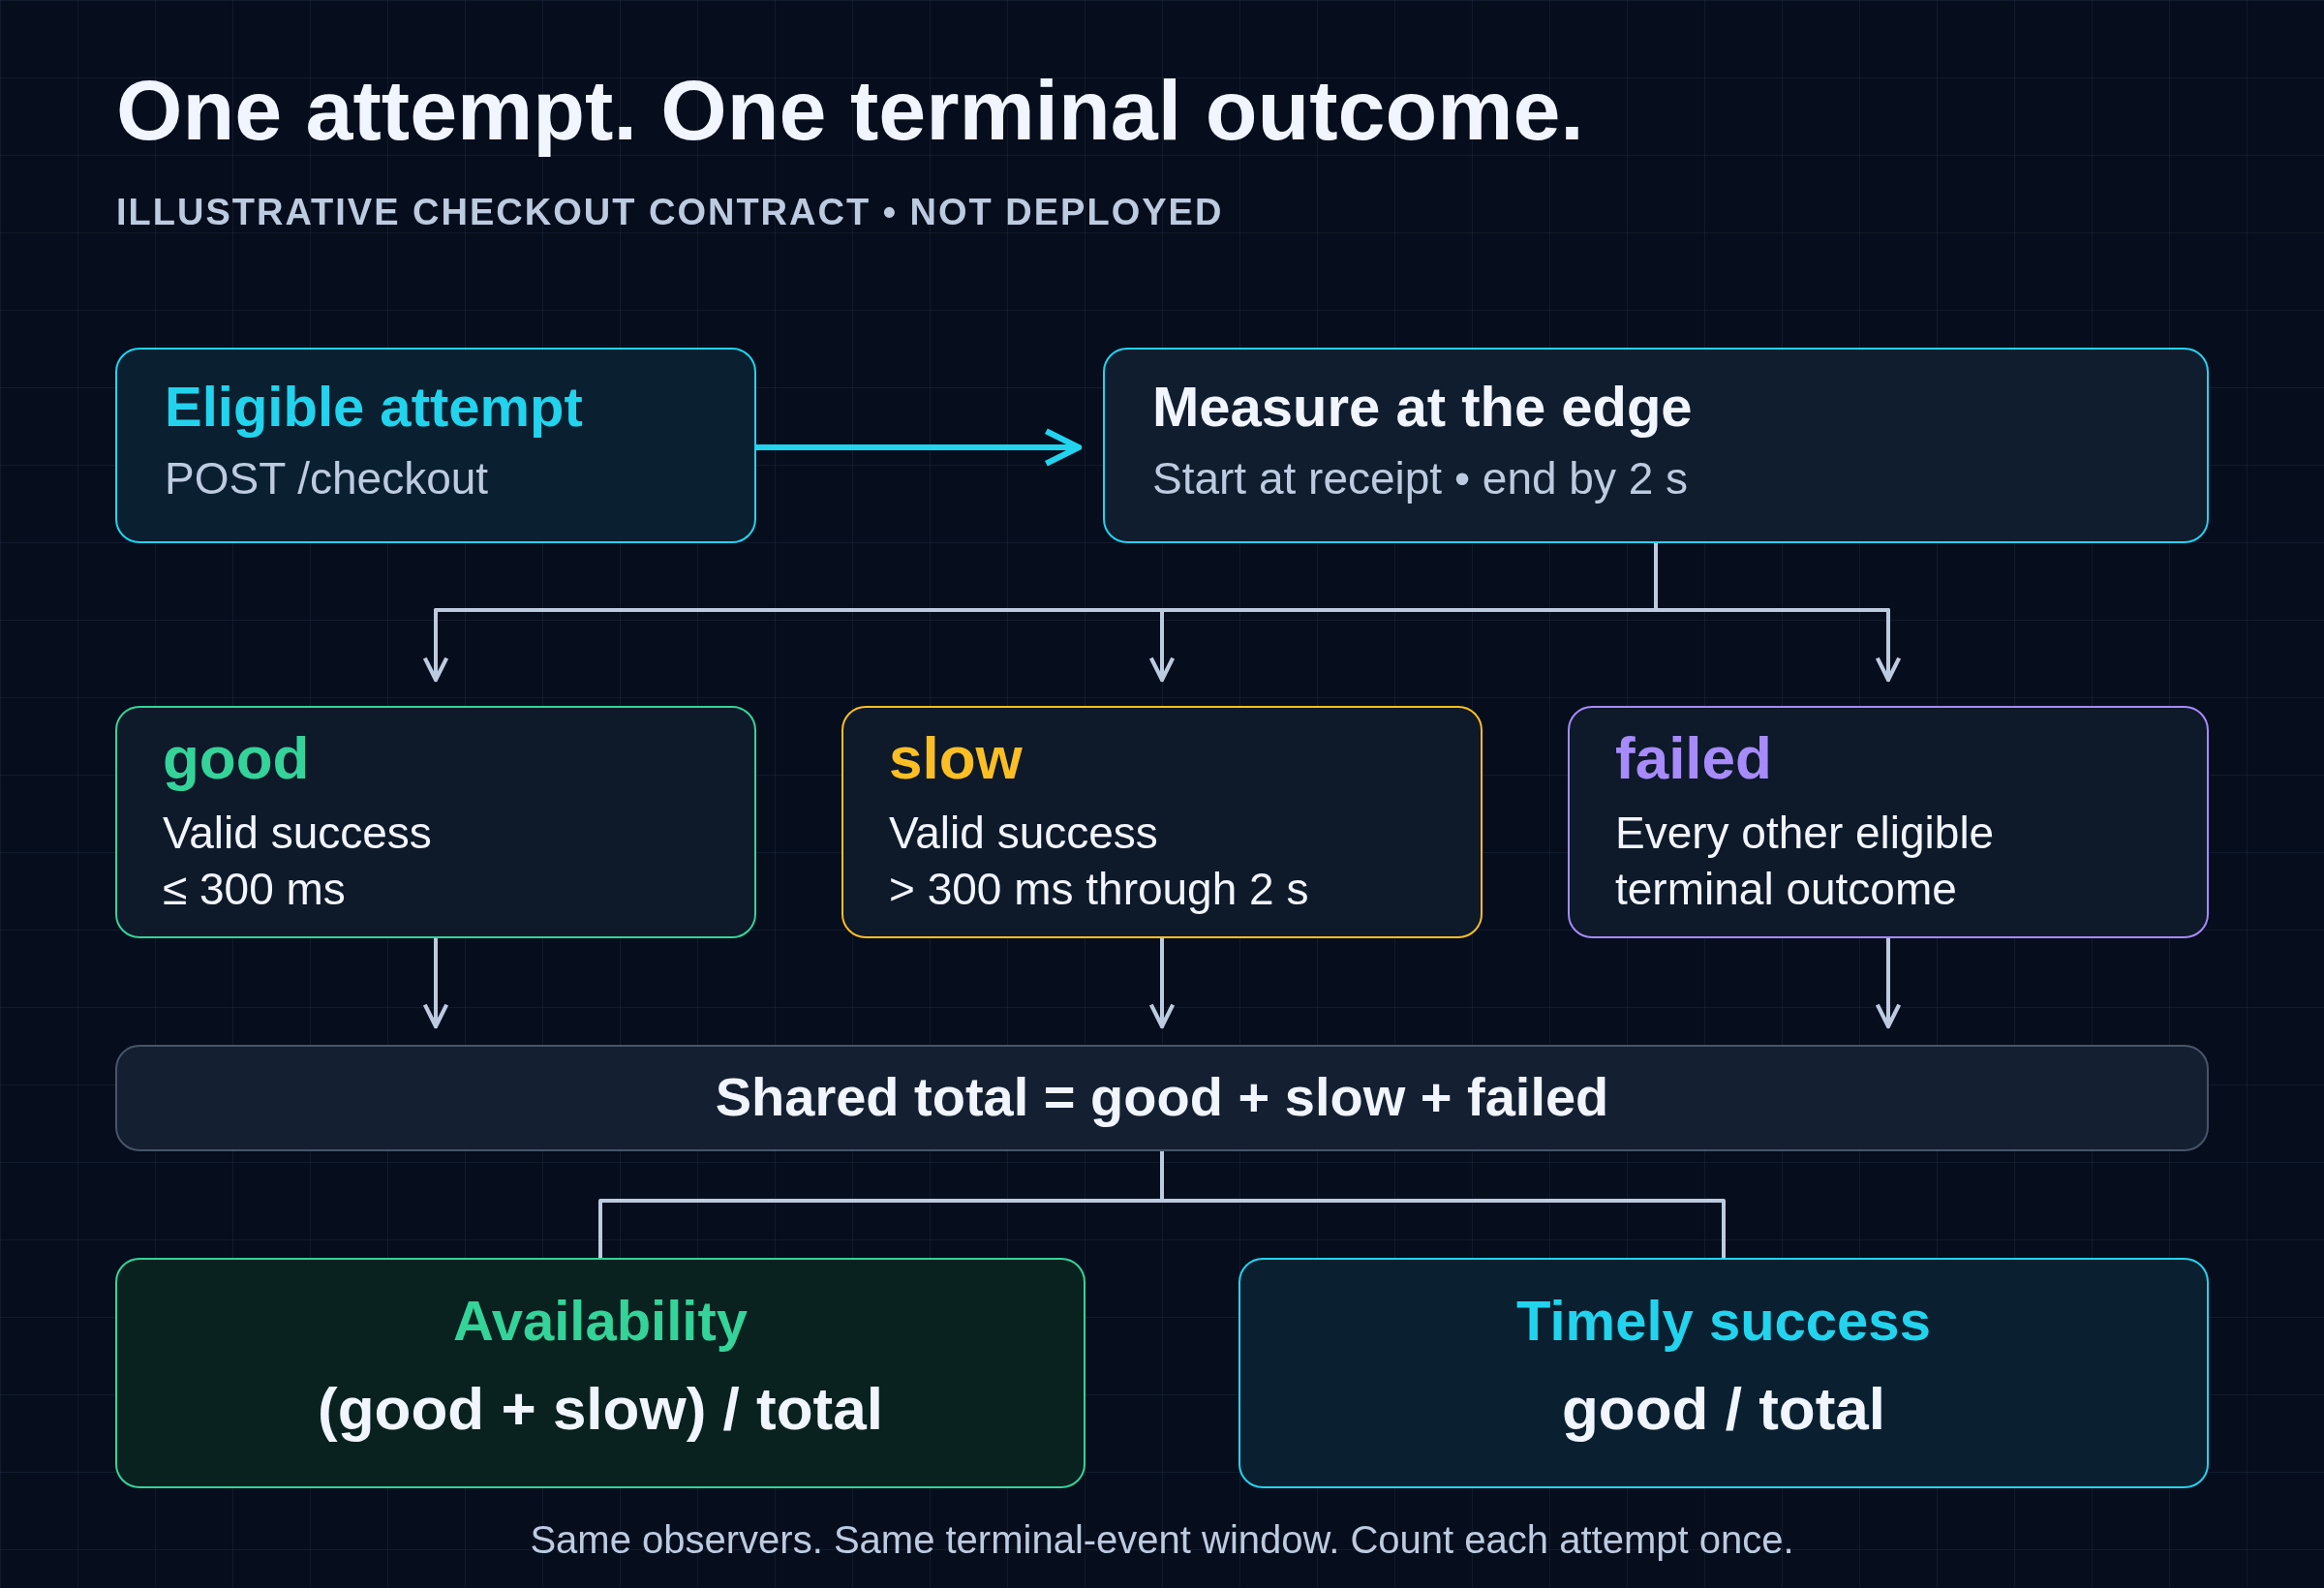
One hypothetical measurement contract, two objectives, one shared population.
That distinction prevents a fast error from improving the timely-success result. Google's monitoring chapter explains why successful and failed request latency need separate treatment, and why an HTTP success status can still carry incorrect content.
The observer therefore needs application outcome signals; transport status alone cannot establish semantic correctness, and an undetected buggy decline that looks well-formed at the transport layer is a measurement limitation that can overstate the SLI rather than a valid success. This is a proposed custom instrumentation contract, not a built-in gateway feature or existing metric. It also misses failures before the observed edge, such as DNS problems, and cannot report its own unobserved disappearance. It is an attempt-weighted proxy for part of the checkout journey, not a complete browser-to-purchase SLO.
How do you query both objectives in Prometheus?
Export one counter family with good, slow and failed outcome series, then divide each objective's good-event count by their shared total. Apply increase to each counter before summing across observers. Return a ratio only when the observed total is positive.
In the stored series we query, the proposed metric is checkout_operations_total, with labels such as service="checkout", instance="edge-a" and outcome="good". Here instance="edge-a" represents a hypothetical scrape-target identity in stored data, not a label the checkout exporter has to set itself. When Prometheus scrapes a target, it automatically attaches job and instance labels to identify the scraped target. Initialize all three outcome counters to zero on every expected observer. Each terminal event increments only one counter. Do not put user IDs or operation IDs in metric labels.
With that contract implemented and scraped, these complete expressions need no recording-rule setup. The availability ratio over the last 28 days is:
(
  sum(increase(checkout_operations_total{service="checkout",outcome=~"good|slow"}[28d]))
  /
  sum(increase(checkout_operations_total{service="checkout"}[28d]))
)
and
(sum(increase(checkout_operations_total{service="checkout"}[28d])) > 0)
Timely success uses only good in the numerator:
(
  sum(increase(checkout_operations_total{service="checkout",outcome="good"}[28d]))
  /
  sum(increase(checkout_operations_total{service="checkout"}[28d]))
)
and
(sum(increase(checkout_operations_total{service="checkout"}[28d])) > 0)
These return fractions; display them as percentages. In PromQL, comparison operators filter out false elements by default, and and keeps left-hand elements, with their values, whose label sets exactly match an element on the right. The final and guard therefore filters out a ratio when the observed total is not positive, though it does not certify that all observers reported correctly.
Prometheus documents that increase adjusts for observed counter resets and extrapolates across the range, which can produce non-integer results even for integer counters. That makes the result an estimate rather than an exact event ledger. Calculate each series' increase before aggregation so independent resets remain visible to the function.
Retain at least 28 days of underlying samples with boundary coverage, and check scrape and ingestion freshness. A newly installed counter does not acquire a full history because the query says [28d]. Long-range raw queries may also be expensive; evaluate recording rules when query cost warrants them, without changing the measurement definition.
For a current five-minute dashboard, use sums of per-series rate(...[5m]), but do not average five-minute ratios or multiply today's rate by 28 days to calculate budget spend.
Sampled counters can miss events during gaps or unseen resets. If exact accounting is required, reconcile against durable, deduplicated terminal-event records; building that system is outside this guide.
How much error budget is left?
For a request-based objective, allowed bad events equal total × (1 − target). Subtract observed bad events to find the remaining budget. Calculate each objective separately, using the same eligible population and window; failures can consume both budgets at once.
Google's SLO implementation guidance recommends good-event ratios and explains how their targets translate into error budgets. Apply that approach to this hypothetical 28-day population:
- 990,500
goodattempts - 8,900
slowattempts - 600
failedattempts - 1,000,000 eligible attempts in total
| Calculation | Availability | Timely success |
|---|---|---|
| Successful events for this objective | 999,400 | 990,500 |
| Measured SLI | 99.94% | 99.05% |
| SLO target | 99.9% | 99.0% |
| Allowed bad events | 1,000 | 10,000 |
| Observed bad events | 600 | 9,500 |
| Remaining budget | 400 | 500 |
| Fraction of budget remaining | 40% | 5% |
For availability, the allowed fraction is 0.1%, giving 1,000,000 × 0.001 = 1,000 failures. Subtracting 600 leaves 400, or 40% of that budget.
For timely success, both slow and failed attempts are bad events. The allowance is 1,000,000 × 0.01 = 10,000; subtracting 8,900 + 600 = 9,500 leaves 500, or 5%.
Both objectives pass, but the engineering decision should not be an unconditional green light. Timely success has little margin left, and slow responses dominate its bad events. Investigating that latency is more relevant to this budget than treating every problem as an availability incident.
Do not add the remaining budgets together: a failed attempt consumes both. Nor are these counts minutes of permitted downtime. Traffic volume determines the impact of an interruption, and a rolling window changes as new events arrive and old events expire. The current allowance is not a fixed monthly allocation.
What should the team do with the result?
Agree on a policy before an incident: normal releases while budgets are healthy, closer review when little remains, and a pause on discretionary feature releases when a budget is exhausted. Assign a service owner and explicit recovery conditions so the numbers lead to decisions.
Google's example error-budget policy uses release restrictions to make space for reliability work, rather than punish teams. The following thresholds are proposed for this example, not universal Google rules:
| State | Engineering action |
|---|---|
| Both objectives met, neither budget below 25%, coverage sound | Permit ordinary releases with normal rollout and rollback controls. |
| Either budget positive but below 25% remaining | Prioritize the dominant failure class; require service-owner review of high-risk changes. |
| Either budget at or below zero | Pause discretionary feature releases, allow incident mitigations and security fixes, and assign a dated reliability action to the service owner. |
Our baseline is already in the caution state because timely success has only 5% remaining. That calls for investigating the slow responses and reviewing risky changes, not automatically freezing every deployment.
Resume paused feature releases when both rolling-window budgets are positive, telemetry coverage is sound, and the owner records remediation and rollout checks. A positive budget below 25% still requires caution. Unknown coverage, no traffic or insufficient history cannot establish the healthy state; the service owner must assess the missing evidence before using this policy to permit normal releases.
Review the policy weekly with product and engineering. Revisit targets when user needs change, but do not rewrite them retroactively to erase a failure.
Budget status never excuses a security incident or data loss. Those require action regardless of the aggregate percentage.
What do zero traffic and missing telemetry mean?
Zero eligible events means there is no request-based SLI for that interval. Missing telemetry means coverage is unknown. Neither means 100% success. Show traffic volume and data-health status alongside the ratio so readers can distinguish an idle service from an unobserved one.
One successful attempt gives 100%, but little evidence. Two attempts with one failure give 50%. Keep those real attempts in long-window accounting; dropping quiet periods would also drop their failures.
The query's traffic guard suppresses an empty or zero denominator. It cannot detect partial loss. If only the good series survives, the ratio can look perfect while failures go unreported. Check every expected observer and outcome series, together with scrape and ingestion freshness. A service-wide absent_over_time check detects total absence, not that kind of partial loss.
Synthetic checks can provide a separate signal during quiet periods. Keep their successes out of the real-user denominator. Google's SLO alerting guidance discusses low-traffic limitations and how artificial traffic can conceal real-user failures.
How can you test the ratio without deploying anything?
Use promtool to evaluate synthetic counters against explicit expected results. The self-contained fixture below tests the timely-success expression for normal traffic, zero traffic and missing telemetry. It checks query behaviour, not the correctness of an observer or a live service.
Save this as checkout-test.yml. In the documented Prometheus test format, expanding notation a+bxn represents a series starting at a followed by n further samples incrementing by b. Here 0+90x28 means a starting value of zero followed by 28 samples increasing by 90. Daily samples keep this artificial example small, not realistic for production scraping.
rule_files: []
evaluation_interval: 1d
fuzzy_compare: true
tests:
  - name: normal-traffic
    interval: 1d
    input_series:
      - series: 'checkout_operations_total{service="checkout",instance="edge-a",outcome="good"}'
        values: '0+90x28'
      - series: 'checkout_operations_total{service="checkout",instance="edge-a",outcome="slow"}'
        values: '0+9x28'
      - series: 'checkout_operations_total{service="checkout",instance="edge-a",outcome="failed"}'
        values: '0+1x28'
    promql_expr_test:
      - expr: &timely |
          (
            sum(increase(checkout_operations_total{service="checkout",outcome="good"}[28d]))
            /
            sum(increase(checkout_operations_total{service="checkout"}[28d]))
          )
          and
          (sum(increase(checkout_operations_total{service="checkout"}[28d])) > 0)
        eval_time: 28d
        exp_samples:
          - labels: '{}'
            value: 0.9
  - name: zero-traffic
    interval: 1d
    input_series:
      - series: 'checkout_operations_total{service="checkout",instance="edge-a",outcome="good"}'
        values: '0+0x28'
      - series: 'checkout_operations_total{service="checkout",instance="edge-a",outcome="slow"}'
        values: '0+0x28'
      - series: 'checkout_operations_total{service="checkout",instance="edge-a",outcome="failed"}'
        values: '0+0x28'
    promql_expr_test:
      - expr: *timely
        eval_time: 28d
        exp_samples: []
  - name: missing-telemetry
    interval: 1d
    input_series: []
    promql_expr_test:
      - expr: *timely
        eval_time: 28d
        exp_samples: []
The YAML anchor &timely names the expression so *timely can reuse it without recording rules. With promtool on your PATH, run:
promtool test rules checkout-test.yml
This exact fixture passed with Prometheus promtool 3.5.0 and returned SUCCESS. The normal case returns 0.9; the other cases return no samples. If your edited fixture fails, inspect the reported expression and expected value rather than replacing empty results with a success default.
Frequently asked questions
Can a latency percentile replace the timely-success ratio?
No. A percentile reports a latency threshold for a distribution; this objective needs the fraction of all eligible attempts that succeeded within 300 ms. Preserve both the success condition and the shared denominator.
A classic histogram ingested and queried as classic buckets can support threshold ratios only when it has an explicit matching bucket boundary, because Prometheus does not interpolate missing classic buckets and returns an incomplete result without warning if only some histograms have that bucket. Counting every fast response would also incorrectly include fast failures.
Should a planned maintenance window be excluded?
Not in this example. If maintenance affects eligible user attempts, those outcomes remain in the denominator and consume budget when bad. Any different eligibility policy must be agreed in advance and describe the service promise honestly.
Does meeting the 28-day SLO mean nobody needs to respond now?
No. An ongoing outage can harm users while the historical ratio still meets its target. Use current operational signals for incident response; the rolling budget informs release risk and sustained reliability priorities, rather than replacing immediate response.
Frequently asked questions
What are SLIs, SLOs, and error budgets?
SLIs (Service Level Indicators) measure service behavior, SLOs (Service Level Objectives) set targets for these behaviors over time, and error budgets quantify allowable failures, guiding reliability priorities.
How is a checkout attempt defined in the article?
A checkout attempt is counted when an external submission to POST /checkout reaches a terminal outcome. Internal retries don't count as new attempts, but new client submissions do, even with repeated keys.
What is a valid result for the checkout API?
A valid result is a semantically correct response delivered within the deadline, including accepted confirmations and correctly handled business declines, but not infrastructure rejections or timeouts.
How do you calculate availability and timely success in Prometheus?
In Prometheus, availability is calculated as (good + slow) / total, and timely success as good / total, using increase on outcome series over a 28-day window, ensuring the total is positive.
What does an error budget tell you?
An error budget shows the remaining allowable failures before an SLO is breached. It helps prioritize reliability over new features, guiding engineering actions based on remaining budget percentages.
How can zero traffic affect SLI calculations?
Zero eligible events mean no SLI for that interval, and missing telemetry indicates unknown coverage. Neither implies 100% success. Show traffic volume and data-health status to discern idle from unobserved services.
About the author
- I’m a hands-on technology architect, engineer and founder of Turing Technology Services, with nearly two decades of experience in software engineering, platform engineering, site reliability engineering and cloud infrastructure. My work combines architecture and implementation with technical leadership, coaching and helping organisations adopt new engineering practices. I’ve worked with organisations including Shell, ING, ABN AMRO, Rabobank, Schiphol Group and Ahold Delhaize, across complex and regulated enterprise environments. On this blog, I share practical guides and perspectives on software architecture, cloud platforms, reliability and AI, explaining the reasoning behind technical choices as well as how to implement them.
Site Reliability Engineering
Practical guides to building and operating reliable services. Explore SLIs, SLOs, error budgets, incident response, toil reduction and SRE engagement models, from individual services to enterprise-wide adoption.